

Question: In the plot below, three normal distributions are plotted, each one is plotted with a different color. Which distribution appears to have the smallest mean?
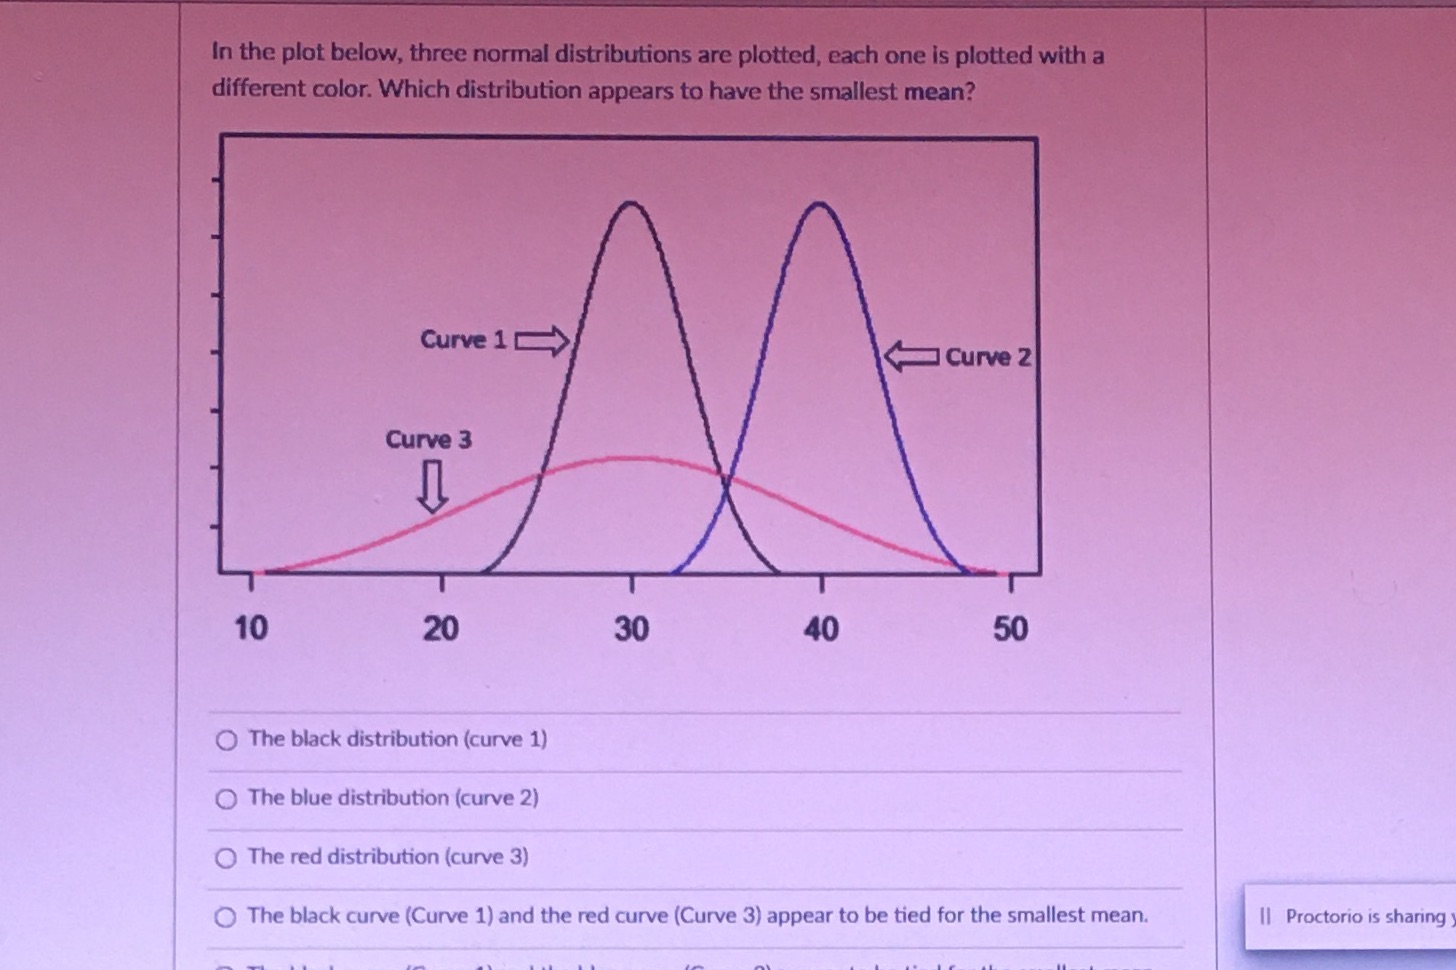

In the plot below, three normal distributions are plotted, each one is plotted with a different color. Which distribution appears to have the smallest mean? Curve 1 Curve 2 Curve 3 10 20 30 40 50 The black distribution (curve 1) The blue distribution (curve 2) The red distribution (curve 3) The black curve (Curve 1) and the red curve (Curve 3) appear to be tied for the smallest mean. I| Proctorio is sharing
Step by Step Solution
There are 3 Steps involved in it
1 Expert Approved Answer
Step: 1 Unlock

Question Has Been Solved by an Expert!
Get step-by-step solutions from verified subject matter experts
Step: 2 Unlock
Step: 3 Unlock