

Question: In the graph below, three normal distributions are plotted, each one is plotted with a different color. Which distribution appears to have the largest standard
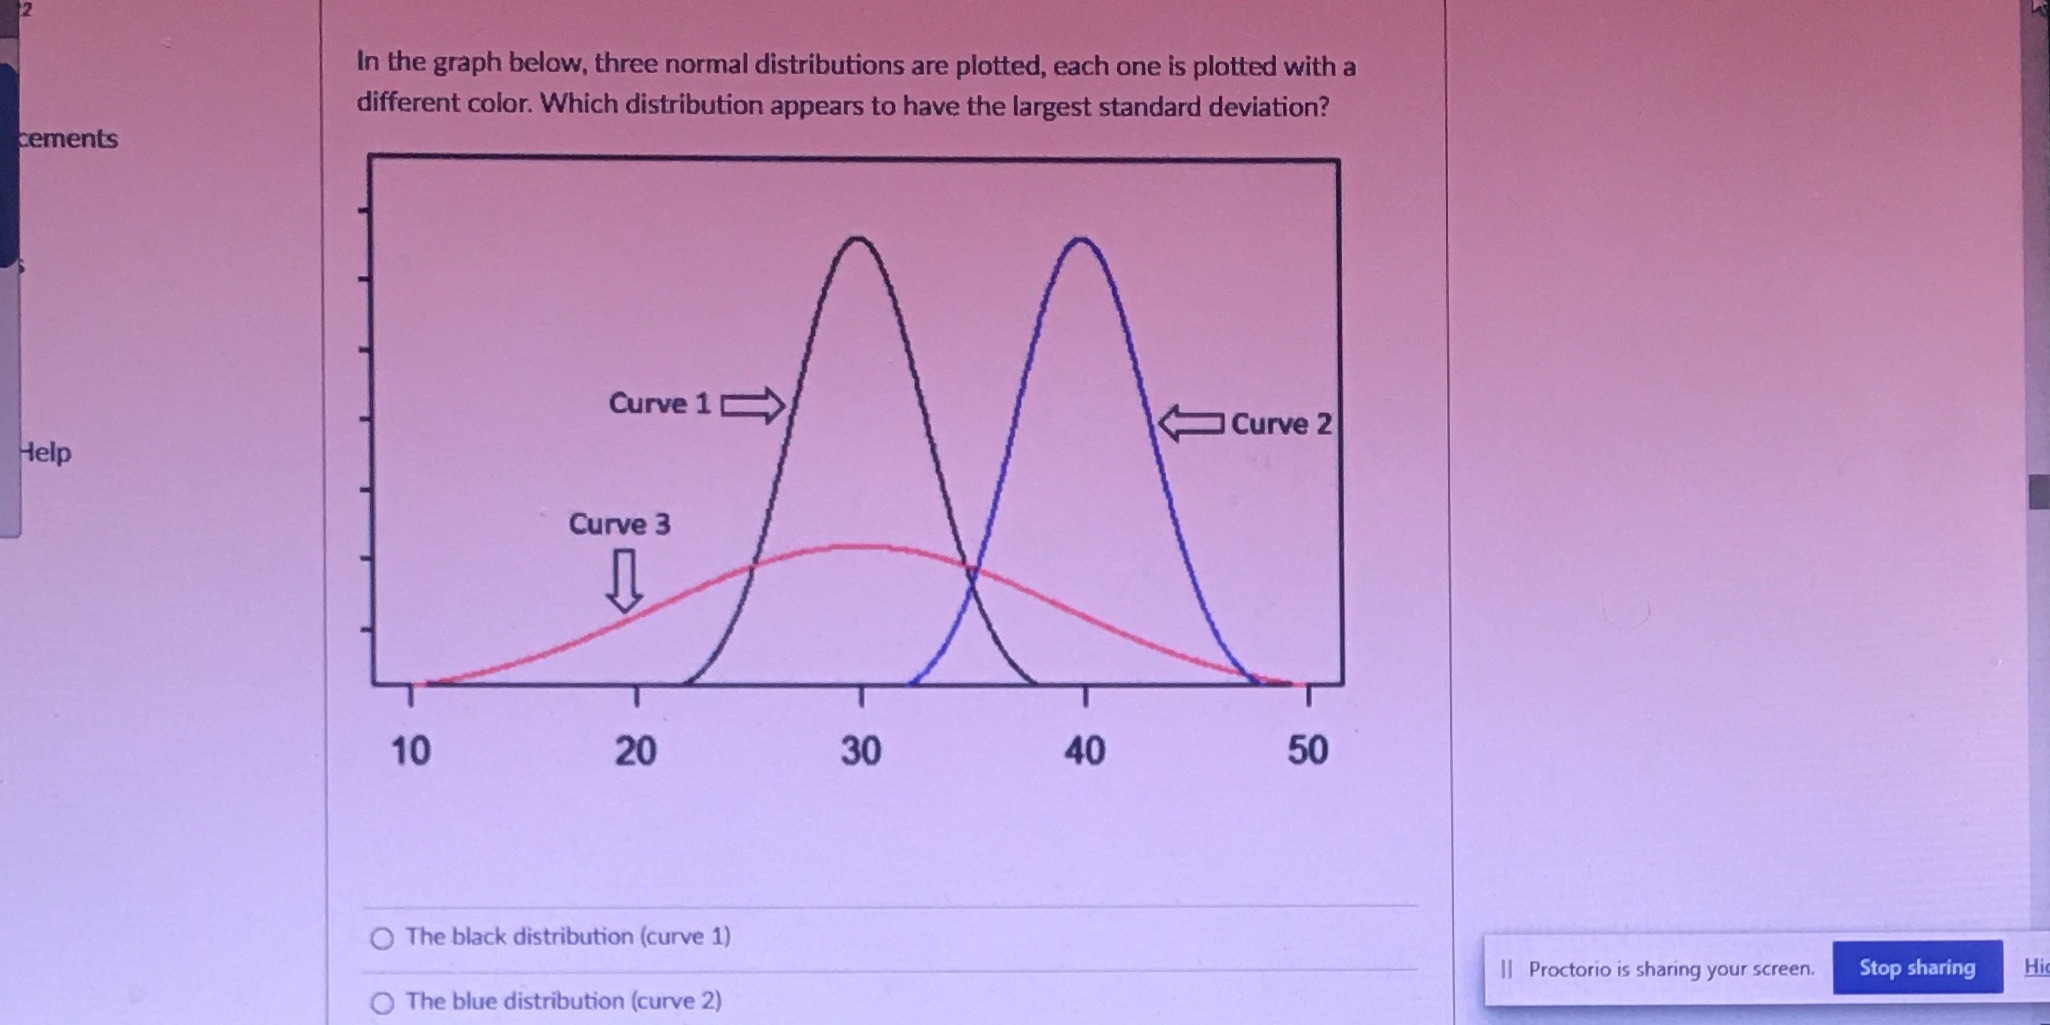
In the graph below, three normal distributions are plotted, each one is plotted with a different color. Which distribution appears to have the largest standard deviation? cements Curve 1 Curve 2 Help Curve 3 10 20 30 40 50 The black distribution (curve 1) II Proctorio is sharing your screen. Stop sharing Hi The blue distribution (curve 2)
Step by Step Solution
There are 3 Steps involved in it
1 Expert Approved Answer
Step: 1 Unlock

Question Has Been Solved by an Expert!
Get step-by-step solutions from verified subject matter experts
Step: 2 Unlock
Step: 3 Unlock