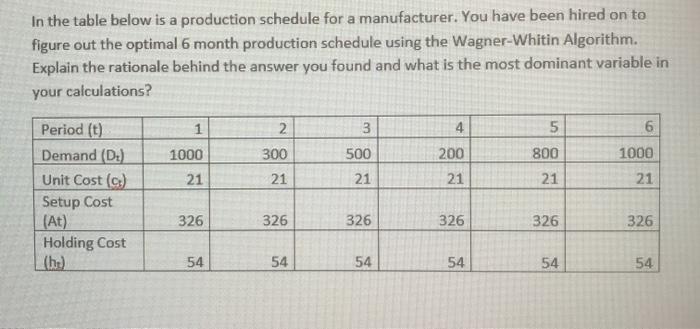
Question: In the table below is a production schedule for a manufacturer. You have been hired on to figure out the optimal 6 month production schedule

In the table below is a production schedule for a
In the table below is a production schedule for a manufacturer. You have been hired on to figure out the optimal 6 month production schedule using the Wagner-Whitin Algorithm. Explain the rationale behind the answer you found and what is the most dominant variable in your calculations? 1 2 4 5 6 1000 300 3 500 21 200 800 1000 21 21 21 21 21 Period (t) Demand (Du) Unit Cost (0) Setup Cost (At) Holding Cost (hu) 326 326 326 326 326 326 54 54 54 54 54 54

Step by Step Solution

There are 3 Steps involved in it

1 Expert Approved Answer
Step: 1 Unlock blur-text-image
Question Has Been Solved by an Expert!

Get step-by-step solutions from verified subject matter experts

Step: 2 Unlock
Step: 3 Unlock

Students Have Also Explored These Related General Management Questions!