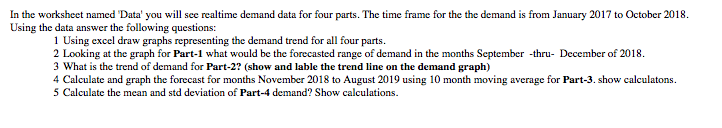
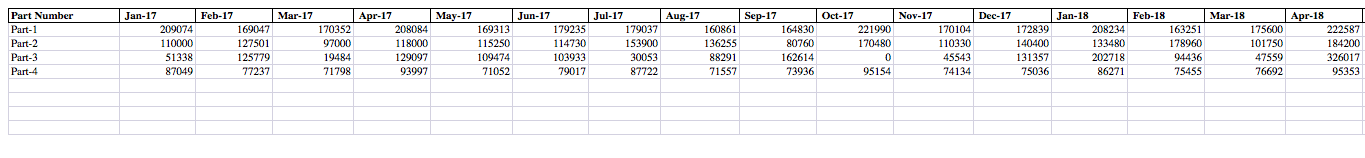
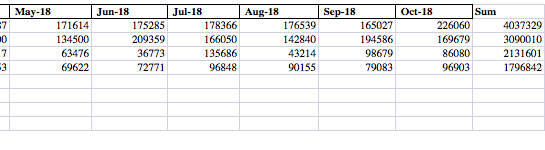
Question: In the worksheet named Data' you will see realtime demand data for four parts. The time frame for the the demand is from January 2017

In the worksheet named Data' you will seeIn the worksheet named Data' you will seeIn the worksheet named Data' you will seeIn the worksheet named Data' you will see

In the worksheet named Data' you will see realtime demand data for four parts. The time frame for the the demand is from January 2017 to October 2018. Using the data answer the following questions: 1 Using excel draw graphs representing the demand trend for all four parts. 2 Looking at the graph for Part-1 what would be the forecasted range of demand in the months September -thru- December of 2018. 3 What is the trend of demand for Part-2? (show and lable the trend line on the demand graph) 4 Calculate and graph the forecast for months November 2018 to August 2019 using 10 month moving average for Part-3. show calculatons. 5 Calculate the mean and std deviation of Part-4 demand? Show calculations. May-17 Sep-17 Nov-17 Dec-17 Feb-18 Mar-18 Part Number Part-1 Part-2 Part-3 Part-4 Jan-17 209074 110000 51338 87049 Feb-17 169047 127501 125779 77237 Mar-17 Apr-17 170352 208084 97000 118000 19484 129097 71798 93997 169313 115250 109474 71052 Jun-17 Jul-17 179235 179037 114730 153900 103933 30053 79017 87722 Aug-17 160861 136255 88291 71557 164830 80760 162614 73936 Oct-17 221990 170480 0 95154 170104 110330 45543 74134 Jan-18 172839 208234 140400 133480 131357 202718 75036 86271 163251 178960 94436 75455 Apr-18 175600 222587 101750 184200 47559 326017 76692 95353 May-18 7 10 Jun-18 171614 175285 134500 209359 63476 36773 69622 72771 Jul-18 178366 166050 135686 96848 Aug-18 Sep-18 176539 165027 142840 194586 43214 98679 90155 79083 Oct-18 Sum 226060 4037329 169679 3090010 86080 2131601 96903 1796842 Show all answers (graphsa and calculations on this sheet Be sure to label everything well so I can find and follow your work. In the worksheet named Data' you will see realtime demand data for four parts. The time frame for the the demand is from January 2017 to October 2018. Using the data answer the following questions: 1 Using excel draw graphs representing the demand trend for all four parts. 2 Looking at the graph for Part-1 what would be the forecasted range of demand in the months September -thru- December of 2018. 3 What is the trend of demand for Part-2? (show and lable the trend line on the demand graph) 4 Calculate and graph the forecast for months November 2018 to August 2019 using 10 month moving average for Part-3. show calculatons. 5 Calculate the mean and std deviation of Part-4 demand? Show calculations. May-17 Sep-17 Nov-17 Dec-17 Feb-18 Mar-18 Part Number Part-1 Part-2 Part-3 Part-4 Jan-17 209074 110000 51338 87049 Feb-17 169047 127501 125779 77237 Mar-17 Apr-17 170352 208084 97000 118000 19484 129097 71798 93997 169313 115250 109474 71052 Jun-17 Jul-17 179235 179037 114730 153900 103933 30053 79017 87722 Aug-17 160861 136255 88291 71557 164830 80760 162614 73936 Oct-17 221990 170480 0 95154 170104 110330 45543 74134 Jan-18 172839 208234 140400 133480 131357 202718 75036 86271 163251 178960 94436 75455 Apr-18 175600 222587 101750 184200 47559 326017 76692 95353 May-18 7 10 Jun-18 171614 175285 134500 209359 63476 36773 69622 72771 Jul-18 178366 166050 135686 96848 Aug-18 Sep-18 176539 165027 142840 194586 43214 98679 90155 79083 Oct-18 Sum 226060 4037329 169679 3090010 86080 2131601 96903 1796842 Show all answers (graphsa and calculations on this sheet Be sure to label everything well so I can find and follow your work

Step by Step Solution

There are 3 Steps involved in it

1 Expert Approved Answer
Step: 1 Unlock blur-text-image
Question Has Been Solved by an Expert!

Get step-by-step solutions from verified subject matter experts

Step: 2 Unlock
Step: 3 Unlock

Students Have Also Explored These Related General Management Questions!