

Question: In these two figures below, what are some positives and negatives in terms of the quality of the data and figures? Things like good/bad p-values,
In these two figures below, what are some positives and negatives in terms of the quality of the data and figures? Things like good/bad p-values, good/bad statistical tests utilized, quality of error bars and standard deviations, etc.
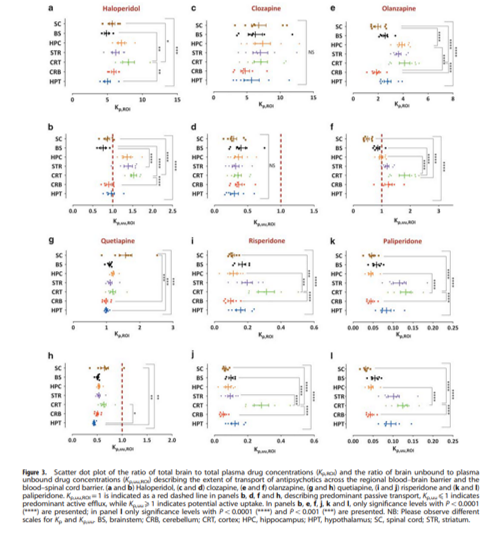
Haloperidol Cleapine Olanzapine SC as HPC STR CRT CRB HPT BS HPC STR CRT CRB HPT HPC STR CRT HPT 10 SC ES PC STR CRT CRB HPT . MPC STR CRT CRB HPT NRC STR CRT HPT 0.0 0.5 10 15 25 0.5 10 15 K. Quetiapine Risperidone Paliperidone . K BS NRC STR CRT CRO HPT 111 HPC STR CRT CRB HPT MPC STR CRT CRB HPT 0.3 0.4 0.00 0.00 0.00 0.150.200.2 h 1 SC HPC STR CRT CRB HPT MPC STR CRT CRB HPT HPC STR CRT CRO HPT os LO 15 02 0.0 0.0 0.0 0.0 0.20 0.25 Figure 2. Scatter dot plot of the ratio of total brain to total plasma drug concentrations Krol and the ratio of brain unbound to plasma unbound drug concentrations to describing the extent of transport of antipsychotics across the regional blood brain barrier and the blood spinal cord barriera and b) Haloperidole and dclozapine, le and olanzapine, and he quetiapine. (I and risperidone and ik and I paliperidone. Kuo 1 is indicated as a red dashed line in panels b. d. f and h, describing predominant passive transport, Kou. I indicates predominant active efflux, while indicates potential active uptake. In panels betk and only significance levels with P
Step by Step Solution
There are 3 Steps involved in it

Get step-by-step solutions from verified subject matter experts