

Question: In this activity we explore the relationship between weight and height for 81 adults. We will use height as the explanatory variable. Weight is the
In this activity we explore the relationship between weight and height for 81 adults. We will use height as the explanatory variable. Weight is the response variable.
We will then label the men and women by adding the categorical variable gender to the scatterplot. We will see if separating the groups contributes to our understanding of the form of the relationship between height and weight.
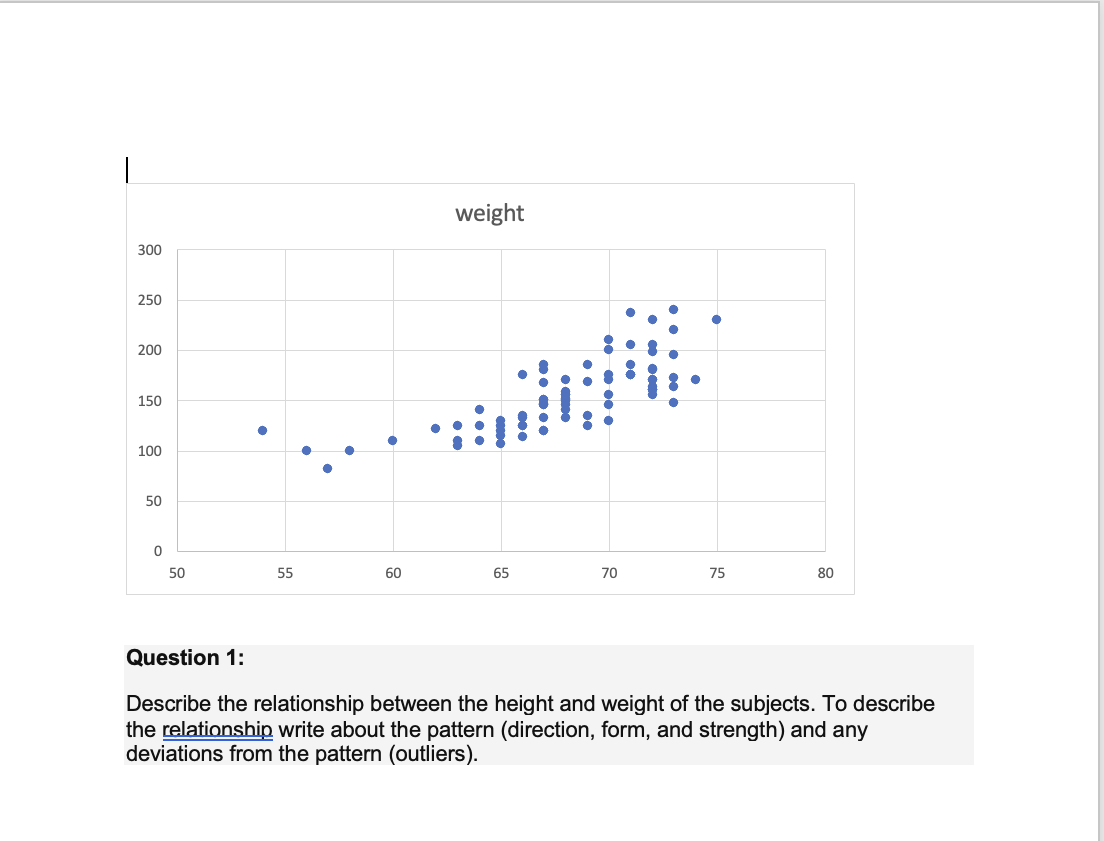
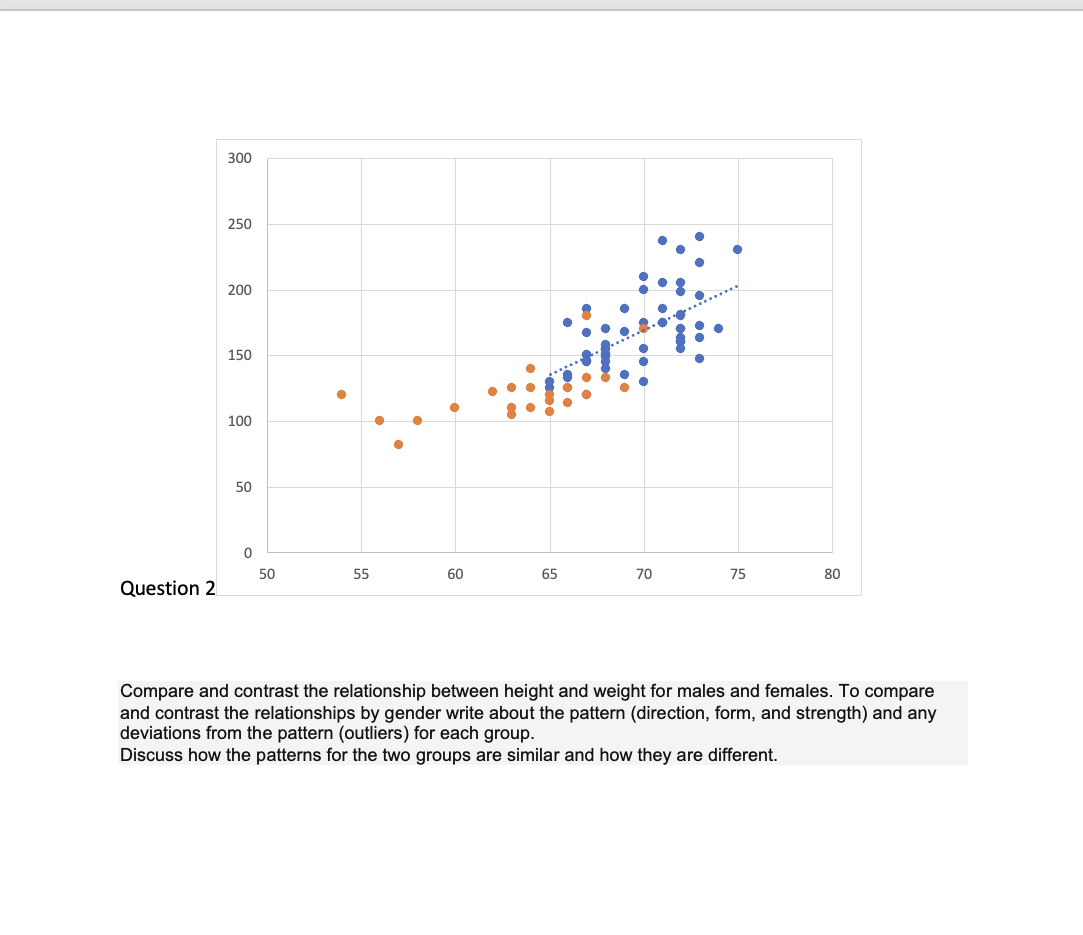
weight 300 250 .0. o O zoo 3'3. 0 :O.I:i:o 150 . 3| 3 o . ...l!: 8 100 o 0 ' C so 0 so 55 so 65 m 3'5 so Question1: Describe the relationship between the height and weight of the subjects. To describe the m write about the pattern (direction, form, and strength) and any deviations from the pattern (outliers). 300 250 . . . . . . 200 0 I .J I ' '3"- . . . .n'...' = . 1501' = o . '- I' . . . o o ' E : o . . . 100 o o ' . 50 0 so 55 6t) 65 10 15 so Question 2 Compare and contrast the relationship between height and weight for males and females. To compare and contrast the relationships by gender write about the pattern (direction, form, and strength) and any deviations from the pattern (outliers) for each group. Discuss how the patterns for the two groups are similar and how they are different
Step by Step Solution
There are 3 Steps involved in it

Get step-by-step solutions from verified subject matter experts