

Question: In this activity, we will investigate whether or not Average Teacher's Salary, Pupil/Teacher Ratio, and Expenditure per Student have a statistically significant correlation with Completion
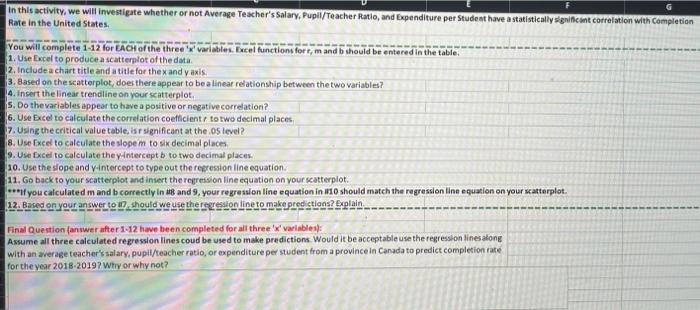
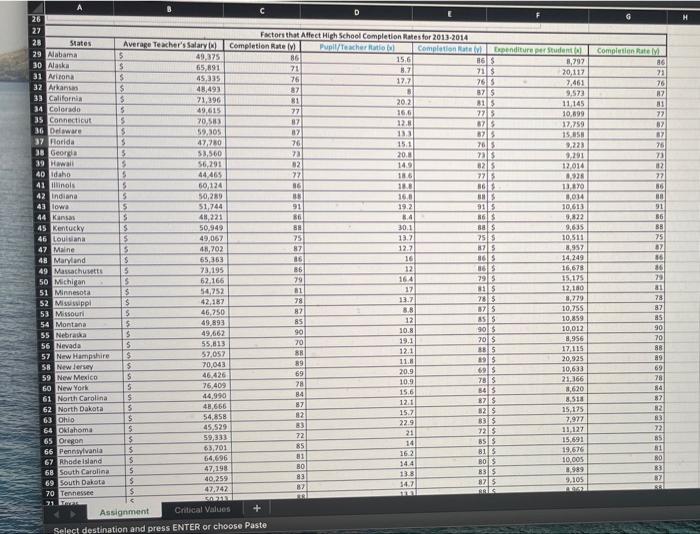
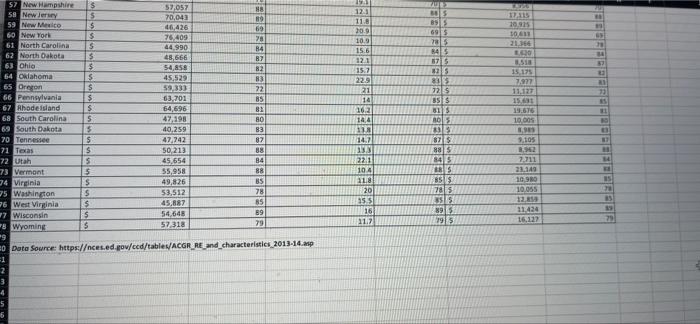
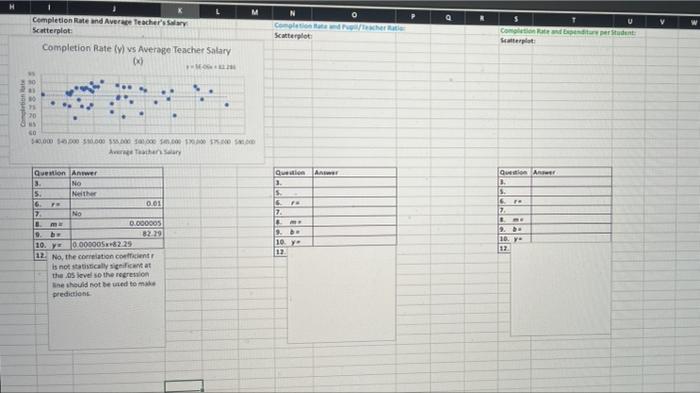
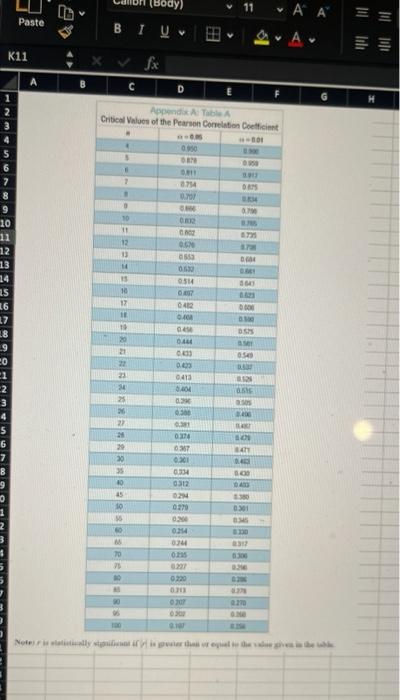
In this activity, we will investigate whether or not Average Teacher's Salary, Pupil/Teacher Ratio, and Expenditure per Student have a statistically significant correlation with Completion Rate in the United States. You will complete 1-12 for EACH of the three'x' variables. Excel functions for r, m and b should be entered in the table. 1. Use Excel to produce a scatterplot of the data. 2. Include a chart title and a title for thex and y axis. 3. Based on the scatterplot, does there appear to be a linear relationship between the two variables? 4. Insert the linear trendline on your scatterplot. 5. Do the variables appear to have a positive or negative correlation? 6. Use Excel to calculate the correlation coefficient to two decimal places. 7. Using the critical value table, is r significant at the.05 level? 8. Use Excel to calculate the slopem to six decimal places. 9. Use Excel to calculate the y-intercept b to two decimal places. 10. Use the slope and y-intercept to type out the regression line equation. 11. Go back to your scatterplot and insert the regression line equation on your scatterplot. ***If you calculated m and b correctly in #8 and 9, your regression line equation in #10 should match the regression line equation on your scatterplot. 12. Based on your answer to 7, should we use the regression line to make predictions? Explain Final Question (answer after 1-12 have been completed for all three 'x' variables): Assume all three calculated regression lines coud be used to make predictions. Would it be acceptable use the regression lines along with an average teacher's salary, pupil/teacher ratio, or expenditure per student from a province in Canada to predict completion rate for the year 2018-2019? Why or why not? 26 27 28 Average Teacher's Salary() Completion Rate (v) 49,375 Factors that Affect High School Completion Rates for 2013-2014 Pupil/Teacher Ratio ( 29 Alabama $ 86 30 Alaska $ 65,891 71 15,6 8.7 17.7 31 Arizona 45.335 76 32 Arkansas 48,493 87 33 California 71,396 81 20.2 34 Colorado 49,615 16.6 35 Connecticut 70,583 12.8 36 Delaware 59,305 13.3 37 Florida 47,780 15.1 38 Georgia 53,560 20.8 39 Hawail 56,291 14.9 40 idaho 44,465 18.6 41 Illinois 60,124 18.8 42 Indiana 50,289 16.8 51,744 19.2 43 lowa 44 Kansas 48,221 8.4 45 Kentucky 50,949 30.1 46 Louisiana 49,067 13.7 47 Maine 48,702 12.7 48 Maryland 65,363 16 49 Massachusetts 73,195 12 50 Michigan 62,166 164 17 51 Minnesota 54,752 13.7 42,187 52 Mississippi 53 Missouri 46,750 8.8 12 54 Montana. 49,893 10.8 55 Nebraska 49,662 19.1 56 Nevada 5 55,813 12.1 57 New Hampshire $ 57,057 11.8 58 New Jersey $ 70,043 20.9 59 New Mexico $ 46,426 10.9 60 New York 76,409 15.6 61 North Carolina 44,990 12.1 62 North Dakota 48,666 15.7 63 Ohio 54,858 22.9 64 Oklahoma 45,529 21 65 Oregon 59,333 14 66 Pennsylvania 63,701 16.2 67 Rhode Island 64,696 14.4 68 South Carolina 47,198 13.8 69 South Dakota 40,259 14.7 47,742 $ 70 Tennessee is -50 213 71 Teras Assignment Critical Values Select destination and press ENTER or choose Paste States $ $ $ $ S 5 S $ S 5 $ $ $ 5 $ $ $ $ 5 $ $ $ 5 $ S 5 $ $ $ $ $ $ $ $ $ 77 87 87 76 73 82 77 16 88 91 86 88 75 87 86 86 79 81 78 87 85 90 70 88 89 69 78 84 87 82 83 72 85 81 80 83 87 8.8 8 Completion Rate (v) Expenditure per Student (a) 86 $ 71 $ 8,797 20,117 76 $ 7,461 87 $ 9,573 815 11,145 77 $ 10,899 87 $ 17,759 87 5 15,858 76 $ 9,223 73 $ 9,291 825 12,014 775 8.928 86 $ 13,870 BS 8,034 91 5 10,613 86 S 9,822 88 $ 9,635 75 $ 10,511 875 8,957 865 14,249 865 16,678 79 5 15,175 815 12,180 78 $ 8,779 87 5 10,755 85 5 10,859 90 $ 10,012 70 $ 8,956 885 17,115 89 5 20,925 69 5 10,633 78 S 21.366 84 5 8,620 87 $ 8,518 82 $ 15,175 83 $ 7,977 72 $ 11,127 85 $ 15,691 81 $ 19,676 BO $ 10,005 83 $ 8,989 87 5 9,105 88 $ 4962 Completion Rate (y) 86 71 76 87 81 77 87 87 76 73 82 77 86 88 91 86 88 75 87 86 36 79 81 78 87 85 90 70 88 89 69 78 84 87 82 83 72 85 81 80 83 87 88 H 57 New Hampshire $ 57,057 58 New Jersey $ 70,043 59 New Mexico 46,426 60 New York 76,409 61 North Carolina 44.990 48,666 62 North Dakota 63 Ohio 54,858 45,529 64 Oklahoma 65 Oregon 59,333 66 Pennsylvania 63,701 85 67 Rhodelsland 64,696 81 68 South Carolina 47,198 80 69 South Dakota 40,259 83 70 Tennessee 47,742 87 71 Texas 50,213 88 72 Utah 45,654 84 55,958 73 Vermont 88 49,826 85 74 Virginia 78 25 Washington $ 53,512 85 26 West Virginia 45,887 $ 89 17 Wisconsin $ 54,648 79 8 Wyoming 5 57,318 9 20 Data Source: https:/ces.ed.gov/ccd/tables/ACGR_RE_and_characteristics 2013-14.p =1 2 3 4 5 6 $ $ $ $ $ $ $ $ $ S $ S $ 5 5 S 88 89 69 78 84 87 82 83 22 193 12.3 11.8 20.9 10.9 15.6 12.1 15.7 22.9 21 14 16.2 14.4 13.8 14.7 13.3 221 10.4 11.8 20 35.5 16 11.7 TUES S 89 5 69 $ 785 845 87 $ 825 83 5 72 $ 85 $ 815 805 835 87 $ 88 5 84 5 88 S 855 78 5 35 5 89 5 195 KUT 17,115 20,925 10,633 21,364 8,620 8,518 15,175 7.977 11,127 15.491 19.676 10,005 8,985 9,105 8,962 7,711 23,149 10,980 10,055 12.859 11,424 16.127 w 19 GHE 28 84 871 83 81 73 85 81 80 13 87 OBOOROOR 14 78 85 19 L Completion Rate and Average Teacher's Salary Scatterplot Completion Rate (y) vs Average Teacher Salary (x) 5053229 ** 4 1.2 60 140,000 $40.000 $10,000 $55.000 50000 5,000 130000 15000 5,00 Average Teacher's Salary Question Answer 3. No S. Neither 6. FR 0.01 172 No B. 0.000005 19. be 82.29 10. y 0.000005x+82.25 12. No, the correlation coefficient r is not statistically significant at the 05 level so the regression ne should not be used to make predictions M ma Completion Rate and Pugl/Teacher Ratio Scatterplot Answer Question 3. S. Fa MY 16. 7. 9. b 10. y 12. S Completion Rate and Expenditure per Student Scatterplat Question Answer 3. S. 16. 10 7 9. 10. y 12 10 11 12 13 14 as 16 17 8 K11 19 21 Paste 2 3 4 5 6 ANTION BIU fx Appendix A: Table A Critical Values of the Pearson Correlation Coefficient -8.05 S " 7 " 0 10 11 12 13 14 15 10 17 11. 20 21 22 23 24 ***RR21 25 GROZ 0670 0553 0.530 0514 0.407 0402 0.404 0.454 0.444 0433 0.423 0413 0404 0.39 0.300 0.381 0374 0367 7 0.301 0.334 0312 0294 0279 0200 0254 0244 0317 0235 6300 0227 0216 0220 4200 AS 0.213 4278 90 0207 0.270 0300 420 100 9.107 8.254 Noter is statistically signis if is greater than or equal to the value given in the be 90 27 26 29 30 35 56 60 M 70 DO 45 (Body) OF 0.950 0878 0811 8.754 0.707 GANG 11 2000 100- 0950 6:00 BRM 0.79 8.785 6.735 www 1000 1900 5641 1200 DOO 8.500 0.575 IWW 0549 0.537 8.528 3150 0:505 0.400 BLANT 100 BATY 0461 1.430 10403 8.380 0.301 8345 A A OCED In this activity, we will investigate whether or not Average Teacher's Salary, Pupil/Teacher Ratio, and Expenditure per Student have a statistically significant correlation with Completion Rate in the United States. You will complete 1-12 for EACH of the three'x' variables. Excel functions for r, m and b should be entered in the table. 1. Use Excel to produce a scatterplot of the data. 2. Include a chart title and a title for thex and y axis. 3. Based on the scatterplot, does there appear to be a linear relationship between the two variables? 4. Insert the linear trendline on your scatterplot. 5. Do the variables appear to have a positive or negative correlation? 6. Use Excel to calculate the correlation coefficient to two decimal places. 7. Using the critical value table, is r significant at the.05 level? 8. Use Excel to calculate the slopem to six decimal places. 9. Use Excel to calculate the y-intercept b to two decimal places. 10. Use the slope and y-intercept to type out the regression line equation. 11. Go back to your scatterplot and insert the regression line equation on your scatterplot. ***If you calculated m and b correctly in #8 and 9, your regression line equation in #10 should match the regression line equation on your scatterplot. 12. Based on your answer to 7, should we use the regression line to make predictions? Explain Final Question (answer after 1-12 have been completed for all three 'x' variables): Assume all three calculated regression lines coud be used to make predictions. Would it be acceptable use the regression lines along with an average teacher's salary, pupil/teacher ratio, or expenditure per student from a province in Canada to predict completion rate for the year 2018-2019? Why or why not? 26 27 28 Average Teacher's Salary() Completion Rate (v) 49,375 Factors that Affect High School Completion Rates for 2013-2014 Pupil/Teacher Ratio ( 29 Alabama $ 86 30 Alaska $ 65,891 71 15,6 8.7 17.7 31 Arizona 45.335 76 32 Arkansas 48,493 87 33 California 71,396 81 20.2 34 Colorado 49,615 16.6 35 Connecticut 70,583 12.8 36 Delaware 59,305 13.3 37 Florida 47,780 15.1 38 Georgia 53,560 20.8 39 Hawail 56,291 14.9 40 idaho 44,465 18.6 41 Illinois 60,124 18.8 42 Indiana 50,289 16.8 51,744 19.2 43 lowa 44 Kansas 48,221 8.4 45 Kentucky 50,949 30.1 46 Louisiana 49,067 13.7 47 Maine 48,702 12.7 48 Maryland 65,363 16 49 Massachusetts 73,195 12 50 Michigan 62,166 164 17 51 Minnesota 54,752 13.7 42,187 52 Mississippi 53 Missouri 46,750 8.8 12 54 Montana. 49,893 10.8 55 Nebraska 49,662 19.1 56 Nevada 5 55,813 12.1 57 New Hampshire $ 57,057 11.8 58 New Jersey $ 70,043 20.9 59 New Mexico $ 46,426 10.9 60 New York 76,409 15.6 61 North Carolina 44,990 12.1 62 North Dakota 48,666 15.7 63 Ohio 54,858 22.9 64 Oklahoma 45,529 21 65 Oregon 59,333 14 66 Pennsylvania 63,701 16.2 67 Rhode Island 64,696 14.4 68 South Carolina 47,198 13.8 69 South Dakota 40,259 14.7 47,742 $ 70 Tennessee is -50 213 71 Teras Assignment Critical Values Select destination and press ENTER or choose Paste States $ $ $ $ S 5 S $ S 5 $ $ $ 5 $ $ $ $ 5 $ $ $ 5 $ S 5 $ $ $ $ $ $ $ $ $ 77 87 87 76 73 82 77 16 88 91 86 88 75 87 86 86 79 81 78 87 85 90 70 88 89 69 78 84 87 82 83 72 85 81 80 83 87 8.8 8 Completion Rate (v) Expenditure per Student (a) 86 $ 71 $ 8,797 20,117 76 $ 7,461 87 $ 9,573 815 11,145 77 $ 10,899 87 $ 17,759 87 5 15,858 76 $ 9,223 73 $ 9,291 825 12,014 775 8.928 86 $ 13,870 BS 8,034 91 5 10,613 86 S 9,822 88 $ 9,635 75 $ 10,511 875 8,957 865 14,249 865 16,678 79 5 15,175 815 12,180 78 $ 8,779 87 5 10,755 85 5 10,859 90 $ 10,012 70 $ 8,956 885 17,115 89 5 20,925 69 5 10,633 78 S 21.366 84 5 8,620 87 $ 8,518 82 $ 15,175 83 $ 7,977 72 $ 11,127 85 $ 15,691 81 $ 19,676 BO $ 10,005 83 $ 8,989 87 5 9,105 88 $ 4962 Completion Rate (y) 86 71 76 87 81 77 87 87 76 73 82 77 86 88 91 86 88 75 87 86 36 79 81 78 87 85 90 70 88 89 69 78 84 87 82 83 72 85 81 80 83 87 88 H 57 New Hampshire $ 57,057 58 New Jersey $ 70,043 59 New Mexico 46,426 60 New York 76,409 61 North Carolina 44.990 48,666 62 North Dakota 63 Ohio 54,858 45,529 64 Oklahoma 65 Oregon 59,333 66 Pennsylvania 63,701 85 67 Rhodelsland 64,696 81 68 South Carolina 47,198 80 69 South Dakota 40,259 83 70 Tennessee 47,742 87 71 Texas 50,213 88 72 Utah 45,654 84 55,958 73 Vermont 88 49,826 85 74 Virginia 78 25 Washington $ 53,512 85 26 West Virginia 45,887 $ 89 17 Wisconsin $ 54,648 79 8 Wyoming 5 57,318 9 20 Data Source: https:/ces.ed.gov/ccd/tables/ACGR_RE_and_characteristics 2013-14.p =1 2 3 4 5 6 $ $ $ $ $ $ $ $ $ S $ S $ 5 5 S 88 89 69 78 84 87 82 83 22 193 12.3 11.8 20.9 10.9 15.6 12.1 15.7 22.9 21 14 16.2 14.4 13.8 14.7 13.3 221 10.4 11.8 20 35.5 16 11.7 TUES S 89 5 69 $ 785 845 87 $ 825 83 5 72 $ 85 $ 815 805 835 87 $ 88 5 84 5 88 S 855 78 5 35 5 89 5 195 KUT 17,115 20,925 10,633 21,364 8,620 8,518 15,175 7.977 11,127 15.491 19.676 10,005 8,985 9,105 8,962 7,711 23,149 10,980 10,055 12.859 11,424 16.127 w 19 GHE 28 84 871 83 81 73 85 81 80 13 87 OBOOROOR 14 78 85 19 L Completion Rate and Average Teacher's Salary Scatterplot Completion Rate (y) vs Average Teacher Salary (x) 5053229 ** 4 1.2 60 140,000 $40.000 $10,000 $55.000 50000 5,000 130000 15000 5,00 Average Teacher's Salary Question Answer 3. No S. Neither 6. FR 0.01 172 No B. 0.000005 19. be 82.29 10. y 0.000005x+82.25 12. No, the correlation coefficient r is not statistically significant at the 05 level so the regression ne should not be used to make predictions M ma Completion Rate and Pugl/Teacher Ratio Scatterplot Answer Question 3. S. Fa MY 16. 7. 9. b 10. y 12. S Completion Rate and Expenditure per Student Scatterplat Question Answer 3. S. 16. 10 7 9. 10. y 12 10 11 12 13 14 as 16 17 8 K11 19 21 Paste 2 3 4 5 6 ANTION BIU fx Appendix A: Table A Critical Values of the Pearson Correlation Coefficient -8.05 S " 7 " 0 10 11 12 13 14 15 10 17 11. 20 21 22 23 24 ***RR21 25 GROZ 0670 0553 0.530 0514 0.407 0402 0.404 0.454 0.444 0433 0.423 0413 0404 0.39 0.300 0.381 0374 0367 7 0.301 0.334 0312 0294 0279 0200 0254 0244 0317 0235 6300 0227 0216 0220 4200 AS 0.213 4278 90 0207 0.270 0300 420 100 9.107 8.254 Noter is statistically signis if is greater than or equal to the value given in the be 90 27 26 29 30 35 56 60 M 70 DO 45 (Body) OF 0.950 0878 0811 8.754 0.707 GANG 11 2000 100- 0950 6:00 BRM 0.79 8.785 6.735 www 1000 1900 5641 1200 DOO 8.500 0.575 IWW 0549 0.537 8.528 3150 0:505 0.400 BLANT 100 BATY 0461 1.430 10403 8.380 0.301 8345 A A OCED
Step by Step Solution
There are 3 Steps involved in it

Get step-by-step solutions from verified subject matter experts