

Question: In this assignment you will address the problem of how to resolve the problem of low 6 -year graduation rate at CSUDH. The 6-year graduation
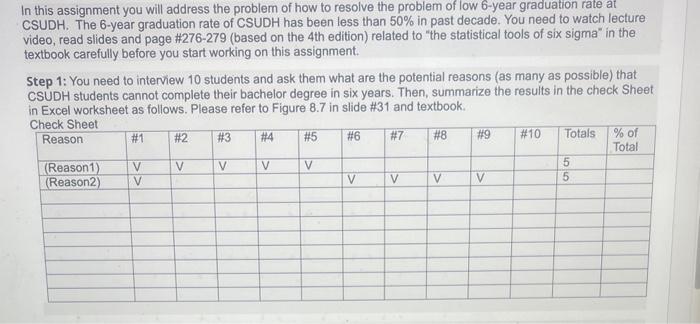
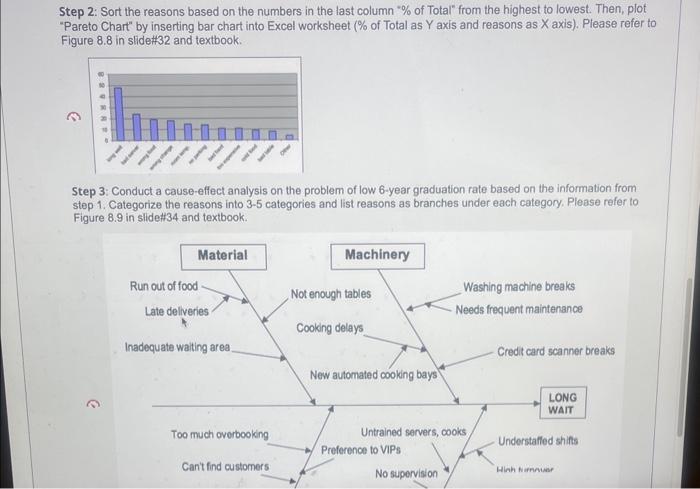
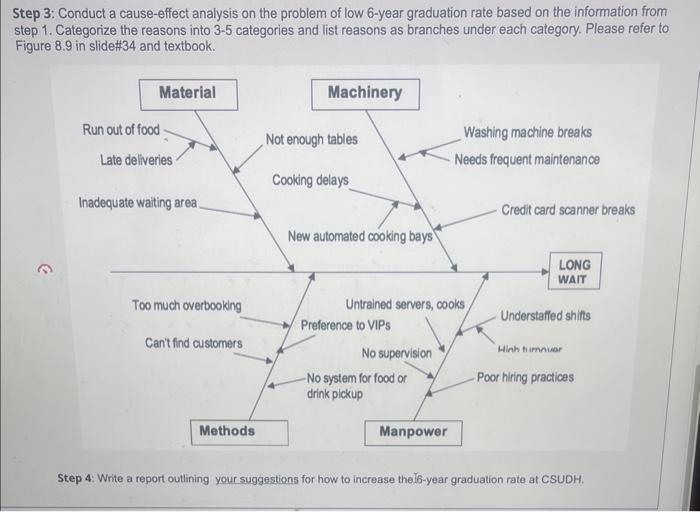
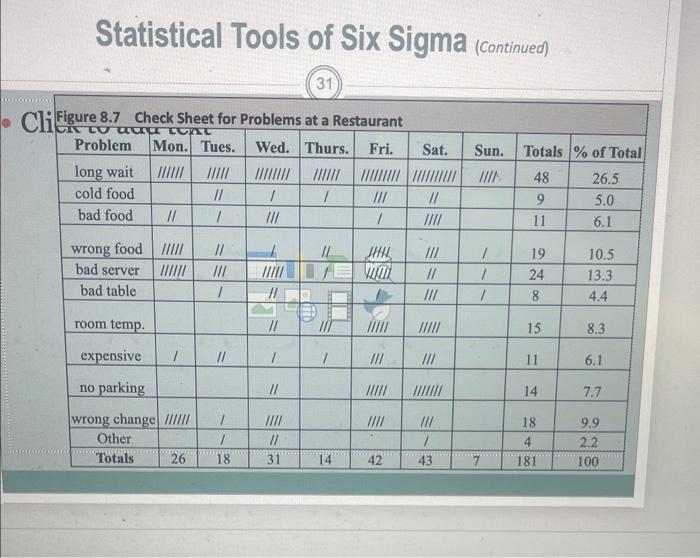
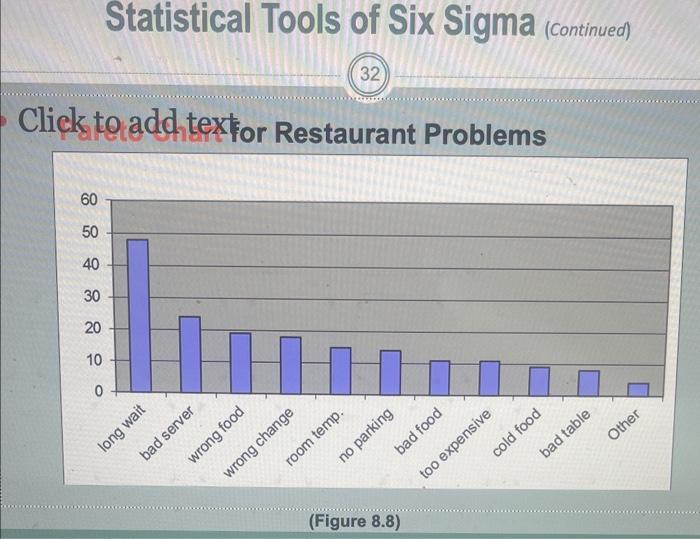
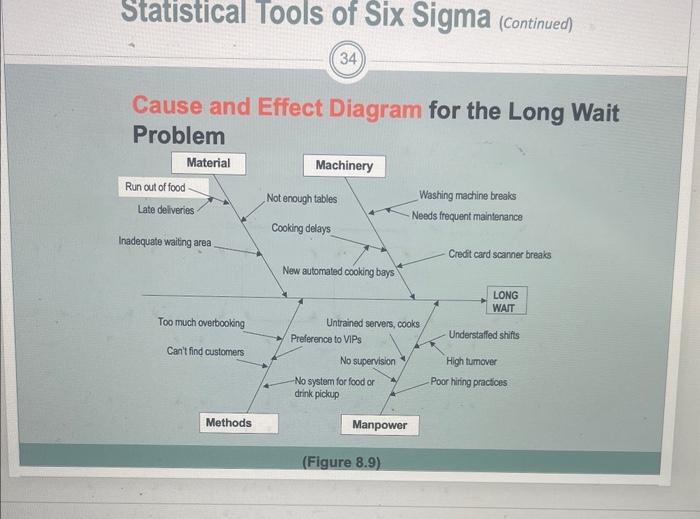
In this assignment you will address the problem of how to resolve the problem of low 6 -year graduation rate at CSUDH. The 6-year graduation rate of CSUDH has been less than 50% in past decade. You need to watch lecture video, read slides and page \#276-279 (based on the 4 th edition) related to "the statistical tools of six sigma" in the textbook carefully before you start working on this assignment. Step 1: You need to interview 10 students and ask them what are the potential reasons (as many as possible) that CSUDH students cannot complete their bachelor degree in six years. Then, summarize the results in the check Sheet in Excel worksheet as follows. Please refer to Figure 8.7 in slide \#31 and textbook. Step 2: Sort the reasons based on the numbers in the last column % of Total" from the highest to lowest. Then, plot "Pareto Chart" by inserting bar chart into Excel worksheet (\% of Total as Y axis and reasons as X axis). Please refer to Figure 8.8 in slide\#32 and textbook. Step 3: Conduct a cause-effect analysis on the problem of low 6-year graduation rate based on the information from step 1. Categorize the reasons into 3-5 categories and list reasons as branches under each category. Please refer to Figure 8.9 in slide\#t 34 and textbook. Step 3: Conduct a cause-effect analysis on the problem of low 6-year graduation rate based on the information from step 1. Categorize the reasons into 3-5 categories and list reasons as branches under each category. Please refer to Figure 8.9 in slide\#34 and textbook. Statistical Tools of Six Sigma (contiveen) (31) Statistical Tools of Six Sigma (Continuen) Click to add textan D Dota...unno D-ah, Statistical Tools of Six Sigma (continueo) In this assignment you will address the problem of how to resolve the problem of low 6 -year graduation rate at CSUDH. The 6-year graduation rate of CSUDH has been less than 50% in past decade. You need to watch lecture video, read slides and page \#276-279 (based on the 4 th edition) related to "the statistical tools of six sigma" in the textbook carefully before you start working on this assignment. Step 1: You need to interview 10 students and ask them what are the potential reasons (as many as possible) that CSUDH students cannot complete their bachelor degree in six years. Then, summarize the results in the check Sheet in Excel worksheet as follows. Please refer to Figure 8.7 in slide \#31 and textbook. Step 2: Sort the reasons based on the numbers in the last column % of Total" from the highest to lowest. Then, plot "Pareto Chart" by inserting bar chart into Excel worksheet (\% of Total as Y axis and reasons as X axis). Please refer to Figure 8.8 in slide\#32 and textbook. Step 3: Conduct a cause-effect analysis on the problem of low 6-year graduation rate based on the information from step 1. Categorize the reasons into 3-5 categories and list reasons as branches under each category. Please refer to Figure 8.9 in slide\#t 34 and textbook. Step 3: Conduct a cause-effect analysis on the problem of low 6-year graduation rate based on the information from step 1. Categorize the reasons into 3-5 categories and list reasons as branches under each category. Please refer to Figure 8.9 in slide\#34 and textbook. Statistical Tools of Six Sigma (contiveen) (31) Statistical Tools of Six Sigma (Continuen) Click to add textan D Dota...unno D-ah, Statistical Tools of Six Sigma (continueo)
Step by Step Solution
There are 3 Steps involved in it

Get step-by-step solutions from verified subject matter experts