

Question: In this assignment, you will calculate various ratios from the financial statements of the Microsoft Corporation (MSFT). The income statement, balance sheet, and cash flow
In this assignment, you will calculate various ratios from the financial statements of the Microsoft Corporation (MSFT). The income statement, balance sheet, and cash flow statement are provided for you. You will calculate the ratios listed on the handout. This exercise will assist you in successfully completing the final project requirements. Calculations (or Excel formulas) must be shown.
Liquidity Ratios
- Current Ratio = Current Assets / Current Liabilities
- Quick Ratio = (Current Assets − Inventory) / Current Liabilities
Leverage Ratios
- Long-term Debt/Equity Ratio = Long-term Debt / Equity
- Total Debt/Equity Ratio = (Short-term Debts + Long-term Debts) / Equity
Profitability Ratios
- Net Profit Margin = Net Profit after Taxation / Sales
- Operating Profit Margin = Operating Profit / Sales
- Return on Equity = Net Profit after Taxation / Equity
- Return on Total Assets = Net Profit after Taxation / Total Assets
- Return on Capital Employed = Net Profit after Taxation / (Total Assets − Current Liabilities)
Efficiency Ratios
- Inventory Turnover = Sales / Inventory
- Assets Turnover = Sales / Total Assets
Market Value Ratios
- Price Earning Ratio = Current Stock Price / Earnings Per Share (EPS)
Other Fundamental Indicators
- Earnings Per Share (EPS) = Net Profit after Taxation / Issued Common Shares
- Net Asset Value (NAV) = (Total Assets − Total Liabilities) / Issued Common Shares
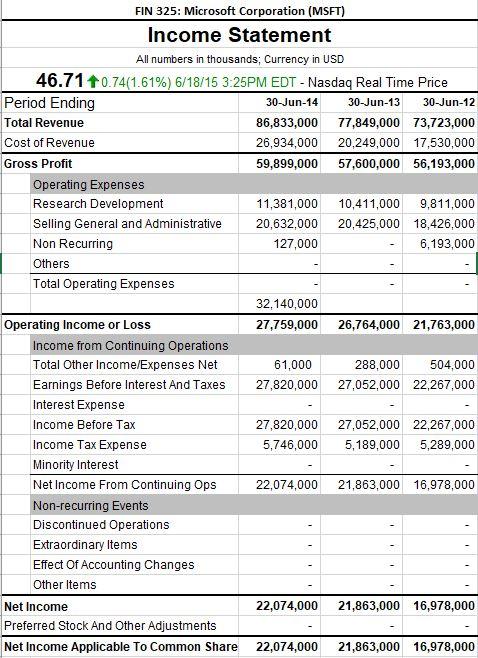
FIN 325: Microsoft Corporation (MSFT) Income Statement All numbers in thousands; Currency in USD 46.71 +0.74(1.61%) 6/18/15 3:25PM EDT - Nasdaq Real Time Price 30-Jun-14 30-Jun-12 30-Jun-13 86,833,000 77,849,000 73,723,000 26,934,000 20,249,000 17,530,000 59,899,000 57,600,000 56,193,000 Period Ending Total Revenue Cost of Revenue Gross Profit Operating Expenses Research Development Selling General and Administrative Non Recurring Others Total Operating Expenses Operating Income or Loss Income from Continuing Operations Total Other Income/Expenses Net Earnings Before Interest And Taxes Interest Expense Income Before Tax Income Tax Expense Minority Interest Net Income From Continuing Ops Non-recurring Events Discontinued Operations Extraordinary Items Effect Of Accounting Changes Other Items Net Income 11,381,000 10,411,000 9,811,000 20,632,000 20,425,000 18,426,000 127,000 6,193,000 32,140,000 27,759,000 - 26,764,000 21,763,000 61,000 288,000 504,000 27,820,000 27,052,000 22,267,000 27,820,000 27,052,000 22,267,000 5,746,000 5,189,000 5,289,000 22,074,000 21,863,000 16,978,000 22,074,000 21,863,000 16,978,000 Preferred Stock And Other Adjustments Net Income Applicable To Common Share 22,074,000 21,863,000 16,978,000
Step by Step Solution
3.40 Rating (150 Votes )
There are 3 Steps involved in it
Current Ratio Current Assets Current Liabilities 250 271 ... View full answer

Get step-by-step solutions from verified subject matter experts