

Question: In this assignment you will create a forecast for a fictitious company using the attached spreadsheet template. Input the following as assumptions in the assumption
In this assignment you will create a forecast for a fictitious company using the attached spreadsheet template. Input the following as assumptions in the assumption part of the spreadsheet (grey highlighted cells at the top of the spreadsheet) and then reference those cells when projecting the appropriate income statement, balance sheet, or break-even account. Do NOT hard code numbers into your projections. Project 2021 2023 Income Statement and Balance Sheet. Assumptions: Sales growth rates in each of next 3 years: 15%, 27%, 35% Operating expenses/sales percentage stay at 2020 level Cost of goods sold stays at 2020 level for 2021 and them improves by .05 in 2022 and by another .02 in 2023 40% tax rate No dividends or new stock issued Interest expense fixed at $400 / year Bank loan and LT debt stay constant 2021 A/R days = year 2020 days, then decrease by 3 days in 2022 & another 3 days in 2023 2022 Inventory days = year 2020 days then decrease by 3 days in 2022 & another 3 days 2023 A/P days stays at year 2020 days Net fixed assets and accruals keep relationship with sales Required cash fixed at 1000 Calculate Additional Funds Needed as plug (to get Balance Sheet to balance!) Calculate 2021 breakeven revenues and units. Assumptions: All operating expenses (excluding interest) are fixed Average price per unit is $50
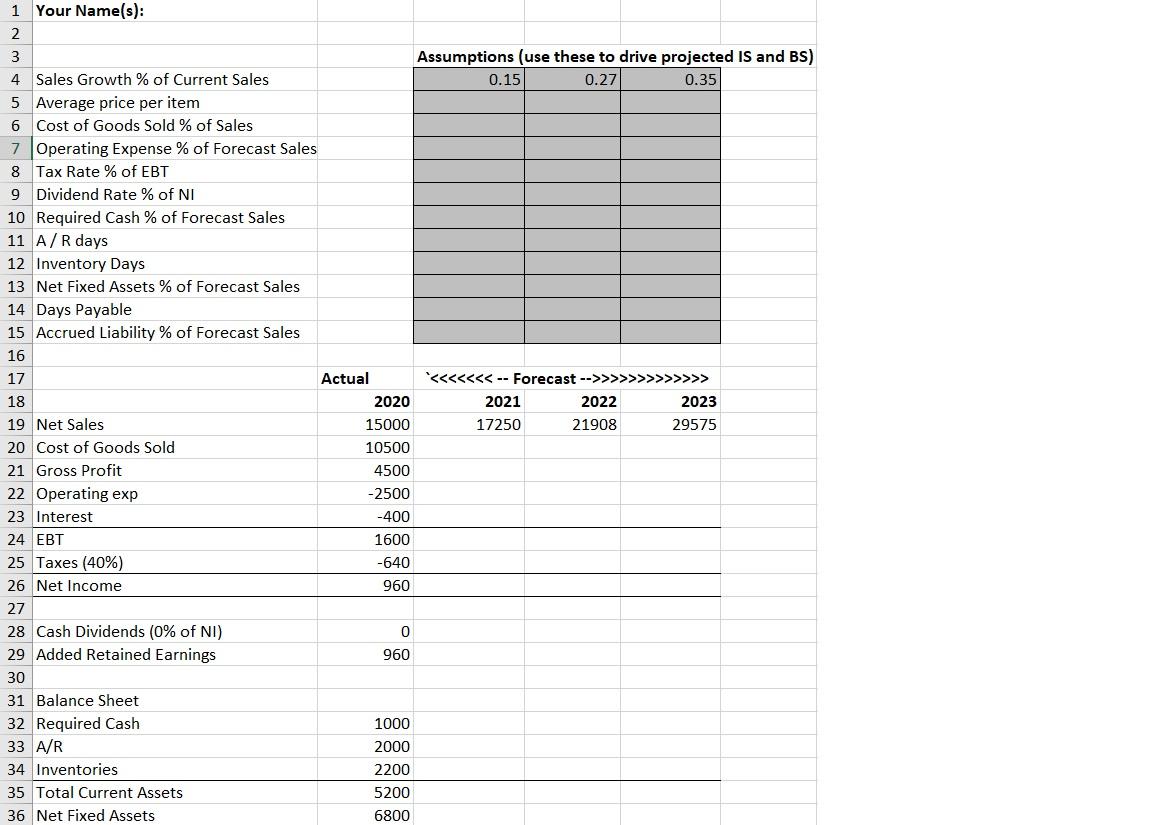
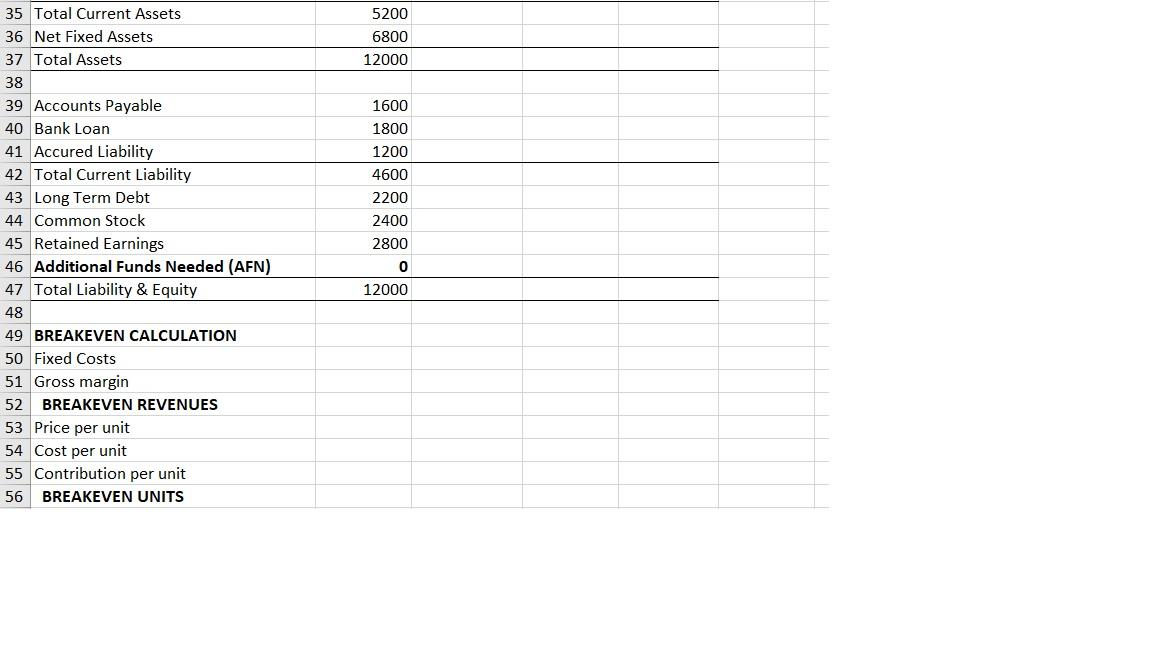
1 Your Name(s): 2 3 Assumptions (use these to drive projected is and BS) 4 Sales Growth % of Current Sales 0.15 0.27 0.35 5 Average price per item 6 Cost of Goods Sold % of Sales 7 Operating Expense % of Forecast Sales 8 Tax Rate % of EBT 9 Dividend Rate % of NI 10 Required Cash % of Forecast Sales 11 A/R days 12 Inventory Days 13 Net Fixed Assets % of Forecast Sales 14 Days Payable 15 Accrued Liability % of Forecast Sales 16 17 Actual >>>>>>>>>>>> 18 2020 2021 2022 2023 19 Net Sales 15000 17250 21908 29575 20 Cost of Goods Sold 10500 21 Gross Profit 4500 22 Operating exp -2500 23 Interest -400 24 EBT 1600 25 Taxes (40%) -640 26 Net Income 960 27 28 Cash Dividends (0% of NI) 0 29 Added Retained Earnings 960 30 31 Balance Sheet 32 Required Cash 1000 33 A/R 2000 34 Inventories 2200 35 Total Current Assets 5200 36 Net Fixed Assets 6800 5200 6800 12000 1600 1800 1200 4600 2200 2400 2800 35 Total Current Assets 36 Net Fixed Assets 37 Total Assets 38 39 Accounts Payable 40 Bank Loan 41 Accured Liability 42 Total Current Liability 43 Long Term Debt 44 Common Stock 45 Retained Earnings 46 Additional Funds Needed (AFN) 47 Total Liability & Equity 48 49 BREAKEVEN CALCULATION 50 Fixed Costs 51 Gross margin 52 BREAKEVEN REVENUES 53 Price per unit 54 Cost per unit 55 Contribution per unit 56 BREAKEVEN UNITS 0 12000
Step by Step Solution
There are 3 Steps involved in it

Get step-by-step solutions from verified subject matter experts