

Question: In this assignment, your learning on predictive analysis is tested on the series of data. You are required to analyse data by applying the techniques


In this assignment, your learning on predictive analysis is tested on the series of data. You are required to analyse data by applying the techniques you have learned in regression analysis.
Please include the excel file.

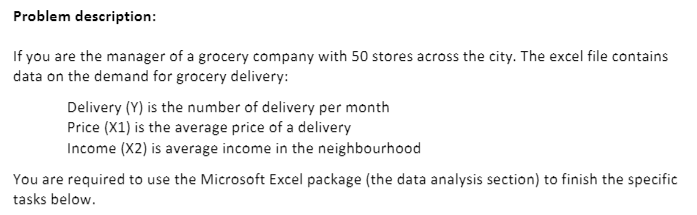
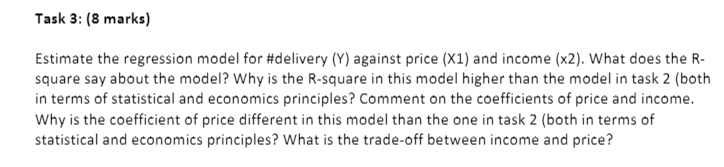
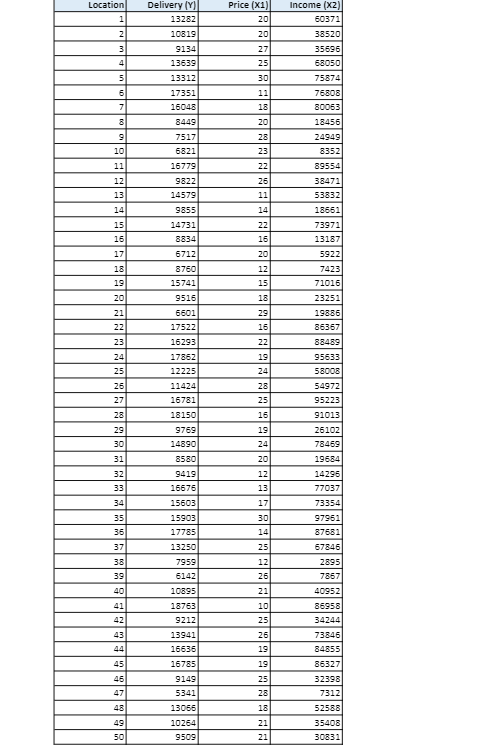
\fProblem description: It you are the manager of a grocery company with 5D stores across the city. The excel file contains data on the demand for grocery delivery: Delivery {'r} is the number of delivery per month Price [11} is the average price of a delivery Income in} is average income in the neighbourhood 't'ou are required to use the Microsoft Excel package {the data analysis section} to finish the specific tasks below. Task 3: [3 marks} Estimate the regression model for #delivery {1'} against price {x1} and income {:2}. What does the H- souare say about the model? Why is the H-souare in this model higher than the model in taslc 2 [both in terms of statistical and economics principles? Comment on the coefficients of price and income. Why is the coefficient of price different in this model than the one in task 2 {both in terms of statistical and economics principles? What is the trade-off between income and price
Step by Step Solution
There are 3 Steps involved in it

Get step-by-step solutions from verified subject matter experts