

Question: In this case study page 1 untill page 7, pls justify the task no 2 which is Summarize the main issues presented in the
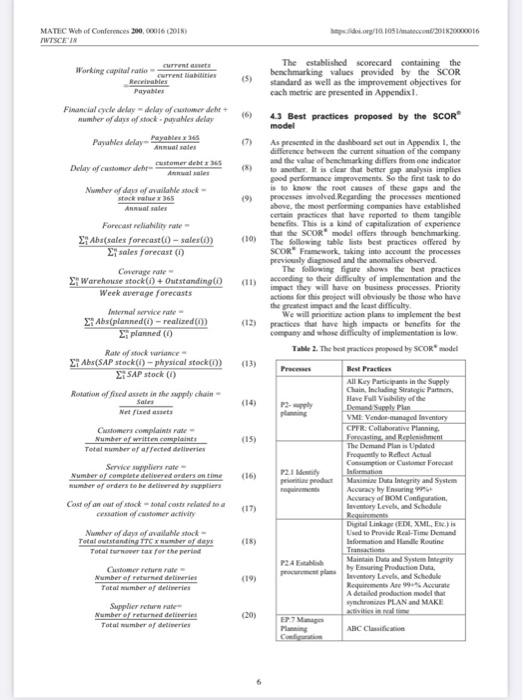
WTSCE'IA the components for the equipment suppliers also established with his of the free zone. Sepply and Production centrol: Tos trades of the Supply model and Production control are exerted in the factory where the role of the logistics consists in supplying the raw material, the components subcoentracted and the components necessary to the manufacturing of the components. The trades of hasdlise interns (receipt, shipping, managenent of the warchouses...) are alw part of this model. Administration of the sales: An administrator in charge of the receipt of the customer oeders, imputatios of the prices, the establishment of the articles client whase finality is the satisfaction of the client in terms of quarnity, quality, and lead-times. Shippine receipt, and transport: The trades of this model are exeried on upstream flows of sepply raw material, components, and sub-contracted componcits Currently. logistics is at the center of all the activitics of the company, divided into 4 business families that cover all logistics activities: from the supply of raw material to the shipment of the fisal peodoct. In addition, logisics is one of the services of the company that makes the most we of the computer took By following. all the flows of the company, by anticipating these flows (forocasts, experesion of needs, etc.) and overflowing beyond from the company to sapplices and customers. For the case of eur company, it uses as masagemeat tools: (1) SAP where the information is ocntralized (Systems, Applications, and Products, ERP), which integrales the differeat functions of the company (accounting. finance, production, supply, marketing. human resources, quality, maintenance, ete.). (2) EDt: for the exshange of various dostaments internally and extemally of the company, it is indeed coenmercial documents or transpot sach as invoices. the planning process within the company that we are going to stady in this paper, is managed by the planner wbo processes once a week his calculation of net need for finished products via SAP, checks the break dates of eacly part, and thanks to an Excel file it establisbes the planning of all the wrek as well as the orders of manufacture of the parts to manafacture. These production orders are then issued to the production manager to be distributed to the production items, once the valid and closed planer has been completed and sent to the saock managet for the recorded on SAP. 4.2 Establishing performance metrics The beschmarking of \\( \\mathrm{SCOR}^{*} \\) model is done by comparing the indicators of level 1,2 and 3, however, it is not necesary to apply the three performance levels in each axis. That is why it would be better to peioritize these axes in order to pet the level indicaton if for less important axes and up to level 3 for the most impoctant. The prioritization of performance aves depending on the company's type of business and its management. SCOR standard set the sotations for prioritising strategic axen of the dashboand that will define for cach ene the objectives to be fixed daring the benchmarking. Indeed, the notations S, A and P are used by the SCOR\" model to prioritive the axes are: - S: a Superior on corresponds to the 90t percestile: This means that it will line up with \10 of the best performing companies. - A: a Advantages carresponds to the 70th percentile: The objective will be to reach the performance of \30 of the best companies. - P: \\& Parity a corresponds to the 50th percentile: The objective is to exceed \50 of the best companies. In order to evaltaste the process performance, it will be very increstieg to eomplete the indicatons that were already in place by other indicators proposed by the \\( \\mathrm{SCOR} \\) model, which correspond to its strategic axes. According to the baseline with which to compare, there are duree types of benchenarking: - Comparison on a historical basis: monitoring indicatoe development. - Internal Benchmarking: is the comparisoe betaven compaties of the same group. - Extermal Benchmarking: The comparison is made by exiemal organizations. The SCOR\" model proposes the exteral benchmaking because the more the reference database will be larger, the results will be significant. The objective here will be to line up with the best companies in the aulomotive scetor basing on logistics activitics. After defining the indicators on the dashboard. we preceded the collection of data to calculate their values. We worked depending oe the importance: - Reliability: basic infornsation for these indicators was derived from the history of logistics rates and weckly reports. - Masagement of assets this data was collected from the Finance Department and management control. Most of them are confidential, so they will be expessed as a perornage. - Logistics costs: this information was collected from the Accounts Department from history. - Reactivity: This indicator corresponds to the lead-time of the tinse required to complete an ordet. - Flexibility: oely the part of the supply was held in account for thes axis becase it is the most important componem in lerms of time. The neat step is the measurement of the performance indicatoes for the dashboard. Indeed, the formulas for calculating the different KPls are presented below: Sinvice rafe \\( (S R)= \\) Number of procesind oriders (1) Number of total arders x SR (dealline) x SR (Acraracy of dociments) (2) Fill rate = \\( \\frac{\\text { Defivered wohume }}{\\text { Capacity of the truck }} \\) *o of rales cass (COGS) = saler - Profits adminintrative couts isales (4) MAnE Whe of Confermes 200, c0016 (2018) IMTECE'IS \\[ \\begin{array}{l} \\text { Warking cupinal ratio }=\\frac{\\text { current anets }}{\\text { cerrent liabizities }} \\\\ \\frac{\\text { Pecrivables }}{\\text { Payabes }} \\\\ \\end{array} \\] Fieancial ovele delay = delay of cashouer dehe + numher of days of stock - panahies alkiay \\[ \\text { PayuNes drlay }=\\frac{\\text { Payaber } x \\text { iss }}{\\text { Anmual rales }} \\] \\[ \\text { Delay of cuntomer dehf- } \\frac{\\text { cuntomer debt } x \\text { acs }}{\\text { Animat iales }} \\] Nwmber of das of anailahle stack = \\[ \\frac{\\text { stack vafue } 365}{\\text { Annual males }} \\] Farneas orlanalicy rate \\( = \\) \\[ \\frac{\\Sigma_{1} A b s(\\text { sales farecast }(t)-\\text { saler }(\\theta)}{\\Sigma_{i} \\text { sales forecast }(t)} \\] (10) Cencrate rale \\( = \\) Zi Warehouse stock \\( (i)+ \\) Outstanding \\( (i) \\) Week atverage forecasts Internal amvice rate = Rale of Aluck variance - Rotarieut offocel assees in the supply chain = \\[ \\frac{\\text { Sairs }}{\\text { Net fired asiets }} \\] Cuetomers complaints rate - Number of writfen cougplaint: Tetel number of affected detiveries Servioe appliers nate Number of complete ifelivered arders an time number of onders to be delivered by noppliens Cast of an eur of stock - total casts rolated to a cersation if exstrmer activiny (11) Number of days of invilahle stack - Total ternewr tar for the peried Cumomer renine rake \\( = \\) Number of retwrmed detiveries Tat al mamber of detiveries Supplier reherw nateNumber of retarmed deliverie: Tatal number of detiveries The establialed scorecard containing the benchmarking values provided by the SCOR standird as well as the improvement objectives for cach metric are presented in Appendixl. 4.3 Best practices proposed by the SCOR model As pecsened in the denbound set eut in Appendix 1, the differeace betwees the current sinution of the eompany and the valse of beactemaking differs from ene indicatoe to asother. It is clear that better gap analysis implies pood porformase impeovernents. So the fint lask to do is to knos the root casase of these pape and the procenos involved Regartiag the processes asentioned above, the most performine compuatics have established certain practices that have reporfed to them tancible bencfies. This is a kind of capitaliarion of expericrice that the scok* modkl effers through benchmarking. The sollowieg uble lass bsat practices offered by sCOR* Framework, taking ints account the processes pecvicully diagnoned and the anomalies obacrved. The folbowiag figute shows the bos practice accending to threir difficulry of implensentation and the impoct they will have on business processes. Prionity actione fer this propect oill ebviously be thoos who bave the preateat ingast and the least difficuliy. We will preeition action plans to ienplement the best practocs that have liph impacts of benefits for the coepuany asd ahose difficulty of implementation is low. Table 2 . The ben pactices peopeed by scon\" model (16) (17) (Is) 6 Guidelines to students 1. Upon completion of each assignment task, students are required to prepare assignment task report. 2. Cut and paste work, plagiarism and undeclared sources will result in an automatic failure. 3. Students are required to conduct a thorough research using various research tools and relevant information search. Students are required to identify the issues or problems for which they must describe, analyze, and discuss in the assignment. 4. Students are advised to conduct the research with some reliable sources (for e.g. E-brary). 5. The assignment should be typed using 1.5 spaces between lines in 12 Times New Roman pointfont. 6. Check carefully the submission date and the instructions given with the assignment. Late assignments will be accepted only for the next 3 days with deduction of 2 marks/day. After 3 days' assignment will not be accepted. 7. If you are unable to hand in your assignment on time and have valid reasons such as illness, you may apply (in writing) for an extension. Assignment tasks 1. Introduce the topic of the article by summarizing the issue, or problems faced in the articles. 2. Summarize the main issues presented in the article. 3. Personal response to the article. MATEC Woh of Conferences 200, 00016 (2018) IWTSCE'IS 5 Conclusion and prospects Being part of a complex and highly competitive ficld, and in order to evalaate its positioe in the asfomotive industries, the company proposed to model its sapply chain and to inglemeat a Benchmarking to improve its performance. To met this need. we opted for the SCOR* model as a dagenostie tool. The first step was to nodel its supply chain, according to the SCOR model. this modet aimed to standardies the seructure of the peocess from the existing model. The sext secp is to develep the dahboard. We were able to compare the company studied with the leading companics in the atomotive ficld through the scrvice offered by the Supply Chain Council. Moreover, based on the results of this benchmarking, we collected the axes that represent an opportanity for impeovement for the company; we selected a set of best practices that can rectify the weaknesses detected at certain axes. To do this, we developed an action plan that is likely to implemeto these best practices. The main prospects for this project are: - For the company. Integration of proposals for improvements in future projects and Logistics Department of the annual performance of external benchmarking, in order to validate and renew the strategic direction of the company: - For research projects: The proposal for a model of the sCORe mothodology adapted to the structure of Motoctan SMEs. 6 Bibliographies 1. J.T. Mentzer, J. S. Kectler, N. W. Nix, C. D. Smith, and Z G. Zacharia, \"Defining Supply Chain Management,\" J. Bus. Logist., 22(2), 1-25 (2001) 2. H. Min and \\( \\mathrm{G} \\). Zhou, \"Supply chain modeling: past, presen and future,\" Comput. Ind. Fng, 43, no, I-2. \\( 231-249(2002) \\) 3. Legistics Performance Index (LP1) Repan (2016): The Gap Persists, WASHINGTON. March 20. Accessed Mai 21, 2018. URL: hetpo/hpi. worldhank org international global/20I6 4. M. Sako and S. Helper, The Information Requirements of Truat in Supplier Relations: Evidence from Japan. Europe and the United States,\" Truet and Ecomowic Learming. \\( 23-47 \\) (1998) 5. P. Grosche, U. Mayrhofer, and S. Schmid, Za configuration at la coondination inecmationales de la chaise de valear dans T'industric automobile allemande,\" Finamc. Cantrole Strat., 1-27 (2015) 6. II Pierreval, R. Bruniaux, and C. Casx, \"A continoous simvalation approach for supply chaizs in the automotive indastry.\" Simul. Model. Pract. Theory, 15 (2), 185-198 (2007) 7. A. Gunasekaran, C. Patel, and R. E. MeGataghey, \"A framework foe supply chain performance ineasurement,\" International Journal of Production Economics, 87 (3), 333-347 (2004) R. H Garcia Reyes and R. Giachetti, Using experts to dcvelop a supply cha matarity model in Mcsico,\" Supply Chain Manag. An Int, Ji, Is (6), 415-424 (2010) 9. K. McCormack, M. Branso Ladcira, and M. Paulo Valadares de Otiveira, \"Supply chain maturity and performance in Brazil,\" Supply Chain Manag. An Int, J., 13 (4), 272-282 (2006) 10. P. Bolstort and K. Roosabaum, Supply Chaim Ercellence: A Handhood for Dramatic Improsement Uring the SCOR Aodel, Thin' Edition (2011) 11. K. Motare, C. Wilkin, and Ceglewaki Andreej. \"Analysis of SCOR's approach to supply chain risk management,\" Mcas. Bas. Fxcell. 21 (2), 191-206 (2014) 12. Supply Chain Council, Soupho Chain Omerations Reforwere Madd' (SCORj (2012) 13. F. R. Lima-Jumior and L. C. R. Carpinetsi, \"Combining SCOR 80 model and funzy TOPSIS foe sapplier evaluation and managcment,\" Int. J. Prod. Feon., 174, 128-141 (2016) 14. G. M. D. Ganga and L. C. R. Carpinceti, \\( { }^{-} \\mathrm{A} \\) farzy logie approach so supply chain performance inahagement,\" Int. J. Prod. Eccan. 134 (1), 177-187 (2011) 15. APICS Supply Chaia Council, SCOR Supoly Chain Operations Refornce Model wer. 12.0 quick nofremer guide (2017) 16. M. 1. Lobas, Performance mocasaremicnt and perfoemance managemens,\" Int. J. Prod. Econ., 41 \\( (1-3), 23-35 \\) (1995) 17. M. S. Nete and S. R. 1. Pires \"Performance Measuranent in Supply Chains: A Study in the Automotive Industry,\" New Advances in Vehicular Technology and Automotive Enginecring. 19 (4). 733-746 (2012) 18. A. Necly, M. Boarne, and M. Kennerley, \"Perfoemance measurement system design: Developing and festing a process basod appeoach,\"Int. J. Opet. Frod. Manag, 20 (10), 1119-1145 (2000) 19. M. Dimbofer, F. Scheckder, and W, A. Gsthacr, \"Logistics performance measurement system for the automotive industry,\" Logist Res, 9 (1), 1-26 (2016) 20. P. Gaiardelli, N. Saccani, and L Songini, \"Performance meakurement of the afler-sales scrvice Bctwork-Evidence from the automsive industry,\" Comput, Ind. \\( 58(7), 698-708(2007) \\) 21. M. Saad and B. Patel, \"An investigation of supply chain performance measurcment in the Indian aufomsotive setor,\" Benchmarkine \\( \\mathrm{An} \\) Int. J. 13 \\( (1 / 2), 36-53(2006) \\) Wrsce's The measarement mechanisuss and performance evaluation have been incorpocated into the commercial atmosphere since the start of mass production. The necd to measure performance has augmented since the creation and evolution of large companies [17]. As said by Necly et al, \\( (1995) \\) the performane meastarement process implicates three eentral concepts; (I) perfocmance measurement: it can be described as the process of quantifying the efficiency and the effectiveness of the actions; (2) performance measured: metric used to measure the efficicsey and of the effectiveness of the action and (3) system of pefocmance measurement: it is the unity of metric used to measure effectiveness and efficiency of actions at the same time. The performance measurement is one of the essential elencnts in the managensent systems, and the performance involves the result of decisions taken [18]. By sweeping the literature on this topic of performance measuremeat in the automsotive industry, it is clear that there are not many articles that deal with methods on this subject. Indecd, the most relevant articles will be qooted below with a summary of the results of each article, and this after filtering the search results in the following academic databases: Science Direct (wwyskiencedinest.com). Scopus (wwy-scopus.com) and Springer (wwospriaccrcom). An additional search was conducted asing the Google Scholar search engine (scholar-google.com). The chain \"performance measurement in automotive industrics\" was used to search for documsents on databases, which followed the described criferia, Below, the most relevant works for our study are presented: Dornhofer et al. \\( (2016) \\) have developed a modular performance measurement system for the automotive logistics chain, A process perspective is included in the performance mcasurement system to increase specificity and facilitate continuous improvement initiatives. Furthermore, by integating the lean logistics principlex. an alignment of their appeoach with the latest developments in logistics concepts in the industry is teached and lean implementation is maintaincd applying a consistent performance measurement system. To ensare standartiration and, at the same time, the flexibility to adapt the performance measurement system to specific logistics processes within a specific company or even manufacturing sute, they suggested a \\( \\mathrm{ccw} \\), modular set-up of the performance measurensent systcm, break down the logistica objectives identified at each stage of the process into the supply chain, from a supplier to the customser. The proposed modular performance measurement system can be designed in line with the processes, resulting in a consistent performance measurement system for the whole logistics chain and offering the potcntial for a supply chain-wide roll-ous while, at the same time, covering sile-specific processes in a standardized way. Additionally, the comparahility of the performance measurement iystem in terms of benchmarking is casured throughout the stages of the logistics process, as well as in the overarching performance measurement system [19]. Gaiardelli et al. \\( (2007) \\) proposed an integrated framework for measuring the performance of the aftermarket network and provided an empirical application to two autombilc record compunics and their official service network. The cases in this study show that performance meavurement syiems of different actors in the supply chain need to be aligned to achieve strategic coherence. Especially, the performance of different actors at the peocess level of the framework concurs in determining the after-sales service overall performance concerning the final customer. Furthermore, liakages at other levels imainly the business and activity ones) may be necded of helpful in ensuring uniformity between stratcgic and operational objectives, inside the organimatioas and thas for the whole supply chain. The afie-sales activities are currently acknowledged as a pertincnt source of revenue. profit and conpetitive advantage in mosh manufacturizg industrics. Top and middle management, therefore. should concentrate on the definition of a structured business performance measurement system for the aftersales besiness. In addition, from the time when many actors are involved along the affer-sale service supply chain, an integrated and multi-attribute set of measures requests to be designed coesistently at every level of the supply chain [20]. Saad and Patel (2006) have studied the relevance of the coecepe of supply chain performance in developing countrics. They have also tried so identify performance measure sets for supply chain perfoenance in the context of a developing nation. Their rescarch cmphases on supply chain practices in the Indian automobile sector, It classifies and discusses the main motives and determinants for the adoption and implementation of supply chain managcment cooccpts. Their research is buit on a combination of qualitative and quantitative methods. Primary data were collected by semti-structured intervicws and an exploratory investigation [21]. Sancher and Perez (2005) have explored the link between the dimensions of supply chain flexibility and firm performunce in a sample of automotive supplicrs. They have foond in this rescarch an optimistic relation between a superior performance in flexibility capabilitics and firm perfoemance, although flexibility dimensions are not equally important for firm performance. On the other hand, the results indicate that firmas are developing more basic flexibility capabilities (at the shop floor level) than overall fexibility capabilities (at the clicetsupplier level). Neverthcless, ageregate flevibility capabilities are more positively connected to firm performance than basic flexibility capabilitics. Therefore, companies might miss epportunities to increase competitiveness by underestinsting customersupplier flecibility capabilities. Finally, the results of this research show that flexibility capabilitics are enhanced in supply chains with higher esvironmental doubt. technological complexity, and mutual understanding, but with lower interdependence among the agemts involved in the supply chain [22] Han et al. (2017) exploest a performance measurement system for a dynamic supply chain partnership in an intercultural context. They built an initial framework by coamining the existing liferature, and then they concretione this framework through an indepth case study in the Chincse auto industry, Afterward. a performance measurement system, includise relational strategy and operational measurement criteria for a supply chain partnership, was developed In fact, and accoeding to them, the relational strategy comtains elements of strategic orientation, managcment style. interdependence, mutual organizational characteristics and common objectives. Operational measurement eriserta are a comnitment, trast, communication behavior, information sharing. decision to participate, quality, production performance, delivery, cost, vendoe strength, attitude, compromise, and loyalty, The last three operational mseasurement criterie are particularly relevant for the infercaltural characteristic \\( [23] \\). Velda and Dhiba (2017) have highliphed through the literafure feview the practices Becessary for the implemenation of supply chain management in the automotive sector in Merocco. They have clsosen as the practice of the supply chain \"the managensent of the supplier relationship\"; they studied its impact on the performance of the autanaker's suppliers, their results using a serics of cquation regressions have highlighted an object of supplier influcnce the performance of supplier relationship management practices of the autonsker in Mafocco [24] On the bases of the revicw of the literature and the best knowledge of the authors, the following remarks were made: - No article on the SCOR model in the automotive indastry as a model for managise the performance of the automotive supply chaia - No articles using an industral application of the SCOR model in automotive induatrics - The framewoeks proposed in the existing articles do not cover the entire global automotive supply chin - The proposed frameworks cannot be transversalised on the various typologies of the entries of the autonsobile sector (OEM, Tier 1. Tier \\( 2 \\ldots \\) ) The purpose of this paper is to mect these secds by applying the SCOR model to an automotive company and taking advantage of the advice of industry professionals and practitioners to assess its benefits and limitations affer deployment. In the follerwing part, the ease stady will be developed with the different stages of the SCOK modeL, nodeliag, betabmarking, performance indicators, gaps and bext practices for the company studied. 3 Methodology This paper aims af providing for the automotive industries a more suitable, practical and concise path for SCOR\" model. Te fulfill this aim it is well docuencnted that case studies provide the very effective approach \\( [29,30] \\). This is advocated by \\( Y \\) in \\( (2009) \\) who recommended that a case study was especially appropriate when trying to answer the thow\" [27]. This is perfoctly useful for our case, which focuses on an industrial application about the applicability of \\( \\operatorname{scoR}^{*} \\) model in auternotive industry firm. Indecd, ouz methodology ased elements of an explanatory case study focusing on the applicability of the SCOK* model. Furthermore, it could also be called an explotatery case study \\( [2 \\mathrm{X}] \\) when it came to undensanding the metrics uscd presembly within the company, their alignment with the proposed SCOK\" model and the integration of the company isa our framework dering the implementation sep. We consequently evaluated the framework uxing a case study at one manafacturing site of a Moroccan automotive andeatry. The comparry Mudied here is an insernatioeal automotive company with more than 45 years of experience in the aubonsotive sector, an annual turnover of approximately 3300 miltion EUR and 14,500 employecs around the world. Fee evaluation purposes, we used a misture of workshops actoss logistical functions and also based on intervievs, documents made avalable and data analysis. The participants are dispersed across all levels of grading. from operative level up to logistics management of the different siscs. In the beginaing, the firat series of wokshops was conducted with the aim of aligaing the logistic objectives found in the litcrature with those uscd on the site. Founded on that, we proposed an open workshop format to collect the required performance indicators from logistics experts within the focus company. The foces was on the transparency of the performance indicatom collected at the time, theif relevance according to the experts' judersests, in addition to the suppleisentary performance indicators that were considered relevant for monitoring and improving logistics processes. Subsequently, the clustering and consolidation of all the performance indicaton proposicd by the SCOR \\( { }^{*} \\) model and identificd in the open woekchop rounds were applied. We eompared our proposed performance indieators with the ones ideatificd in the cyperts' workshops. Performance indicators which were not named by the experts, but proposed in standard SCOR\", were highlighted and discusecd in respect of their added value in a supplement mocting. The subsequent model was aligned in another round of workshops and additional interviews. After changing the detailed defintion of the SCOR* model and each measure falignment with data morecs, addeng responsibiliticsk the system was implemented and data evaluatioa started, as well as a dahbourd allowing performance indicator evaluation launched. Based on that, a quantitative evaluation of each metric was started, which also emphasized initial improvement potentials. After having implemented the modet and finalined its deployment, two beainstorming sexsions were conducted to cempare the different expericaces with this peojest and to capitaline en it. This allowed us to highlight the contributions of this model for the autismotive industrics and in return for the weaknesses that can be impreved on future research. 4 Case Study 4.1 A brief description of the company The conpasy already present at Tunisia, chose to develop in Moroco in order to accompany its clicrt and to have a base of production of platic systems able to delsver the manufacturess based in Spain. The prodactioe site Metal understands about ten presses to be followed from 150 to 800 tons and transforms approxinately 10000 tons of steel a year. It issues components for the body-in-white of the vchicles of a car maker. The plastic factory of peoduction infegrates approsimately about \\( \\mathrm{tcn} \\) press 350 and 2700 toas and tranaforms approximately 3500 tons of annul plastic. It issues components interiof and external and engines for the two vehicles, but also of LATEC Web of Cundercnces 200, 00016 (2015) VTSCE IX performance measurement, benchmarkine and implementation of best practices. Carrently, our company sbould first meck to make a diagnosis of the performance of its supply chain to identify critical performance and improve their processes. 2 literature review 2.1 The Supply Chain Operations Reference (SCOR) model In SCOR*\", the integrated procenes of PLAN, SOU KCE. MAKE, DEL.IVER, RITURN and ENABLE from the applicr's nupplier to the customer's customer represent supply chain management. Elements of businen process engincering, metrics, benchmarking, lesding practices, and people skils into a single framswork afe combincd with SCOK* [10]. The versoe 4 was the Grst to include return process is the supply chain. The Revisions of the model are made by the members of the Council when it is detemined that modifications need to be made to facilitate the use of the model in practice [11]. The relcase of version 11 for access as well as the incopporation of the new material inte all \\( 500 k^{*} \\) traising and certificatioe progams, are asnounced by the Supply-Chain Council (SCC), the plobal not-forprofit organization supporting supply chain professionals. and oducaton [12]. This major update includes Enable Process, Best Practices, and Redesign Costs. Theae updates bring the eurrent model with the way these peocesses. practices, and measures are necded to practitioners of the supply chain that implement the model [12] SCOR describes the busincss activities related to all plases of the satisfaction of a cussomer request. The model itself is structured afound primary managememt peocesses and on \\( \\$ \\mathrm{SCOR}^{*} \\) version 11 . ENABLE is advanced to one of these processes, so there are six: PLAN, MAKF, SOURCE, DELIVER, RETURN, and ENABLE Using these process definition blocks, SCOR * can be used to model supply chains that atc very simple of very complex using a common sat of defintions in disparate indastrien. In fact, public and private organizations and companies around the world use the model as a basis for projects to improve the global supply chain \\( [12] \\). These processes focas on performance management. information, politiks, the inventory strategy, capital. transportation, phyxical legistics network, regulatery and sther management processes to crable Plarning and execution of supply chain activities. SCOR \\( { }^{2} \\) covers all customer relationships, product and market sarroanding customer orden, purchase eeders, work orders, teturm authorizations, forecasting and replenishment oeden. It alse includes physical trovement of raw materialk, work is progess, finixhed goods and merchaedise rebars [10] The SCOK* model has three levels of process detail. In practice, Level I describes the number of supply chans, how their performance is mcasured, and necessary conpetisive requarements. Level 2 presents the configuratioe of the planning and execution strategies in the material flow; involving standard categories such as \"make-to-stock\", \"make-to-onder\" and \"engineer-to. order, Level 3 conaiden the basiness processes and sytem functionality esed to peocess sales orders. purchase eeders, work orden, retum authorizations. replenishment enders, and forccasts. Level 4 pnocess details are not contained in \\( 5 \\mathrm{SOOR}^{*} \\) but must be defincd to implement impoorcmats and manage processica. Advanced asers of the frameack have defincd proces detail as far as Lod 5, sottwase coafiguration detal [10]. Organivatios asing the model SCOR\" performance metrics can compute their parficmance levels compured to other organirations in the sapply chain osing a benchmarkise sool called sCORmak. The SCORmank database coetains Mitoeical data from over 1000 campanies and 2000 supply chains. The benchmarking process using the SCORmurk can be performed by the following acpe: (1) defining the supply channels to he compared; (2) meaviring the internal and external performances, (3) compures the performanes to felevant industrial cempanies; (4) establiah coerpetitive demands; (5) calculate the opportunity value of improveracnt [18,19]. To facilitate the comparison, the SCORmark stratifies the peocess performance according to three poents \\( [14] \\) - \"Seperior\"; is the performance (median value) ou a specific incficator antained by 10\\%s of the beat daseified SC-3 coepparing to the fotal of the supply chains ancyod: - \"Advantage\" is the performance (median valae) amoeg the top 10 cempanies and the modian of all the sapply chains considerte: - \"Parity\", is the performanes (medias value) of all the noply chaina comidered. The APNCS\" \\( { }^{2} \\) he association announced the launch of the SCOR model version 12a. Devclopid by a panel of intermational sapply chain experts, bis latest version of SCOR incorpurates Ome-chanet, metadata, Dlockchain and other energing espies that supply chain professionals are wing soday. SCOR has beca the global inter-mectorial standand for supply chain excellence over the last 20 years and, with this epdate, will coetinue to support ways to meanare, inprove and communicate the supply chaimis besences periormance [15]. 22 The performance measurement in the automotive industry Lebar (1995) ecesiden that performance is buil by the management peceodes porformance metsurcment and makes setse of it. He says that performance meakaremsint and performance manapoment cannot be cuclusively eo menemerment, without undentanding that the measures only speak of the cansequactess of the decisions that croatod the coetcet of performance, have missed the opportunity to take ceetrol and master the process of creatioe of performance and success for the company of orpantraticeal eait cramincd [16] \"APICS is the mosciation for suply chain management and the lrading provider of research, education and certification programs that devate supply chain evecllence, insovatice, asd resilhence. Supply Chain Performance Measurement: A Case Study about Applicability of \\( \\mathrm{SCOR}^{\\oplus} \\) Model in Automotive Industry Firm 'The Innovative Technologies Laberabory. Natienal School of Applied Sciences, 90000. Tangier, Moeocce \"The thigher School of Technology of Berrechid, Hawan the 1\" university, 26000, Seltat, Merocoo Abstract. The evaluation ef a supply shain is a magor priority of compranics: if is a task that remains difficulr doe to the complexify of these systems [1]. This cvaluation imvolves a selestioe of then nesessacy to heve a structured appreach ated adequale mcthedological vools [2] Indecd, we propose in this puper a practical method that will model in the fint place a Mecocean aubemotrve supply chain, aceording to the SCOR \\( { }^{*} \\) model (Supply Chain Opcrations Rellerence), peoposed by the Supply Chain Council. This method will also identify at each level the appeopriale indicatoen for the performance evaluation depending on the strategic vision, In tha context our researth problem is To the best knowledpe of the authoen, this is the firs work that proposes a case study believed to be easy to understand, practical and waitahle for the aulomotive sector. In short. this sudy is a ral applicatice leap to resohe the problematic unanvacred of practical SCOKN \\( ^{*} \\) model usine an industrial application in the Moroccan autoenotive sector. 1 Introduction Over the past ten years, logistics sector in Morocco went through a strong growth. A development has been reflected in the improvement of the performance of the Logistics Performance Index (L.PJ) cstablishod anneally by the Werld Bank. Thus, Moroceo is eurrently at the 86th place worldwide in logistics performance affer bcing at 94th in 2007 [3]. A national strategy has becn implemented in Morocco to improve logistics performance and develop the compctitiveness of Moroccan basinessex. Indecd, the supply chain is a wellunderstood function and successfully deployed in large enterprises, this function remains masenderstood and underexploated in Moroccan astomotive companics. The main assumption is that automotive firm requires tools specifically designed and talorod on their characteristics and necds [4]. The atomotive industry is a highly globalized scctor, where for many actors there is competition from around the world. Faced with the increase in supply and the strong pressure on prices. reinforesd by the power of Asian groups (Toyota. Hyundai, etc.) and the arrival of bew players from emerging countrics (Geely. Tata Group, etc.). many companics seck to optimize their value chain in order io femain competitive [5]. In the sapply chain of the automative industry, many factories are working together to manufacture a product (car, msotor, ete.). To mect customer needs, they must be designed and organized appropriatcly [6]. Logistics can be considered a key coenpetitive factor in the automotive industry due to the inctcasing number of variants and options of the model. With the growing importance of logistics [7]. the evaluation of logistics effectivencss and efficicncy is gaining increased attention [4]. For this reason, the automotive mectoe characteristics and carrent performance measurement practice have becn reviewed and analyad to derive the main characteristics of an effective model for an automotive firm \\( [4,7] \\). Morcover, there are many coetinuous improvemcnt tools such as total quality management, six sigma, continuous peocess improvement and others that are available for companies to improve their operations. However, none of these improvencents programs is dedicated to the logintics chain \\( [8] \\). The SCOR* model was utilired becase of ita process oricntation and growing use among professionals and academics who are dircectly involved with supply chains [9]. \\( \\operatorname{scos}^{6} \\) is also bocoming the common language for benchmarking and comparing supply chains and supply chain management practices [9]. Thus, in order to improve busincss systcms, the return on investment, to deal with competitiveness and optimize the efficicncy of their supply chain, soerse global companies apply the SCOR modet. In this context and for the same reasons, our company planned to model its sapply chain based on the same model since if already has a quality management system based on the process approach. To mect these cxpectations, we followed the \\( \\mathrm{SCOR}^{*} \\) methodology, which is based on Corresponding author: lemehari.radouane gesmil com
Step by Step Solution
There are 3 Steps involved in it

Get step-by-step solutions from verified subject matter experts