

Question: In this case study, you will evaluate the financial performance of three major commercial banks: Bank A, Bank B, and Bank C. You are
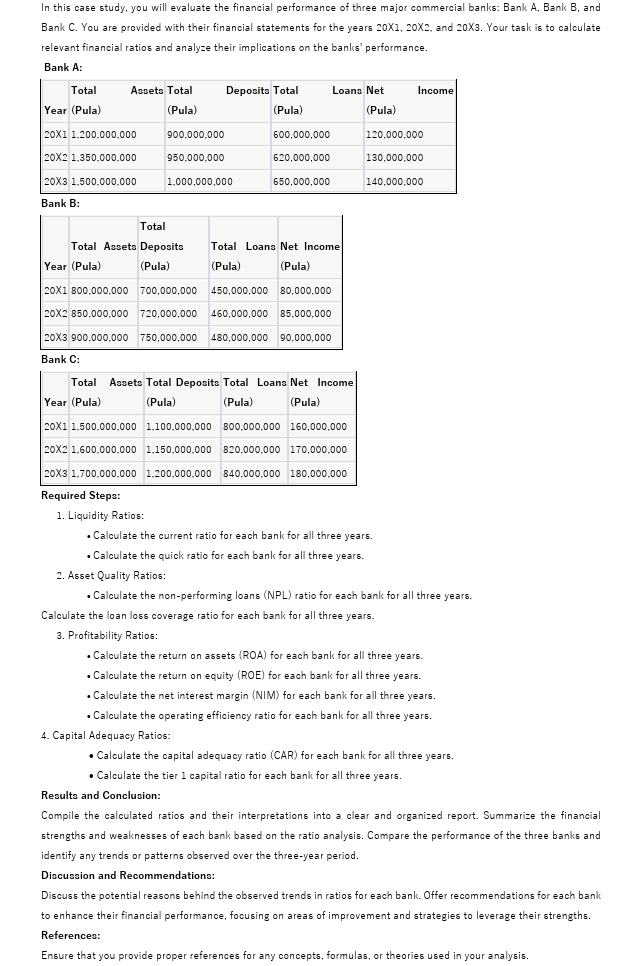
In this case study, you will evaluate the financial performance of three major commercial banks: Bank A, Bank B, and Bank C. You are provided with their financial statements for the years 20X1, 20X2, and 20X3. Your task is to calculate relevant financial ratios and analyze their implications on the banks' performance. Bank A: Total Year (Pula) Assets Total (Pula) Deposits Total (Pula) Loans Net Income (Pula) 20X1 1,200,000,000 900,000,000 600,000,000 120,000,000 20X2 1,350,000,000 950,000,000 620,000,000 130,000,000 20X3 1.500.000.000 1,000,000,000 650,000,000 140,000,000 Bank B: Total Total Assets Deposits Total Loans Net Income Year (Pula) (Pula) (Pula) (Pula) 450,000,000 80,000,000 20X1 800,000,000 700,000,000 20X2 850,000,000 720,000,000 460,000,000 85,000,000 20X3 900,000,000 750,000,000 480,000,000 90,000,000 Bank C: Total Year (Pula) Assets Total Deposits Total Loans Net Income (Pula) (Pula) (Pula) 20X1 1.500.000.000 1.100,000,000 800,000,000 160,000,000 20X2 1.600,000,000 1.150,000,000 820,000,000 170,000,000 20X3 1,700,000,000 1,200,000,000 840,000,000 180,000,000 Required Steps: 1. Liquidity Ratios: Calculate the current ratio for each bank for all three years. Calculate the quick ratio for each bank for all three years. 2. Asset Quality Ratios: Calculate the non-performing loans (NPL) ratio for each bank for all three years. Calculate the loan loss coverage ratio for each bank for all three years. 3. Profitability Ratios: Calculate the return on assets (ROA) for each bank for all three years. Calculate the return on equity (ROE) for each bank for all three years. Calculate the net interest margin (NIM) for each bank for all three years. Calculate the operating efficiency ratio for each bank for all three years. 4. Capital Adequacy Ratios: Calculate the capital adequacy ratio (CAR) for each bank for all three years. Calculate the tier 1 capital ratio for each bank for all three years. Results and Conclusion: Compile the calculated ratios and their interpretations into a clear and organized report. Summarize the financial strengths and weaknesses of each bank based on the ratio analysis. Compare the performance of the three banks and identify any trends or patterns observed over the three-year period. Discussion and Recommendations: Discuss the potential reasons behind the observed trends in ratios for each bank. Offer recommendations for each bank to enhance their financial performance, focusing on areas of improvement and strategies to leverage their strengths. References: Ensure that you provide proper references for any concepts, formulas, or theories used in your analysis.
Step by Step Solution
There are 3 Steps involved in it

Get step-by-step solutions from verified subject matter experts