

Question: In this example, we will write software to help a college teacher who wants to grade on a curve. Specifically, the instructor teaches a class
In this example, we will write software to help a college teacher who wants to grade on a curve. Specifically, the instructor teaches a class that has 50 students and five exams. The instructor will assign a letter grade to each student on each exam based on this distribution:
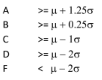
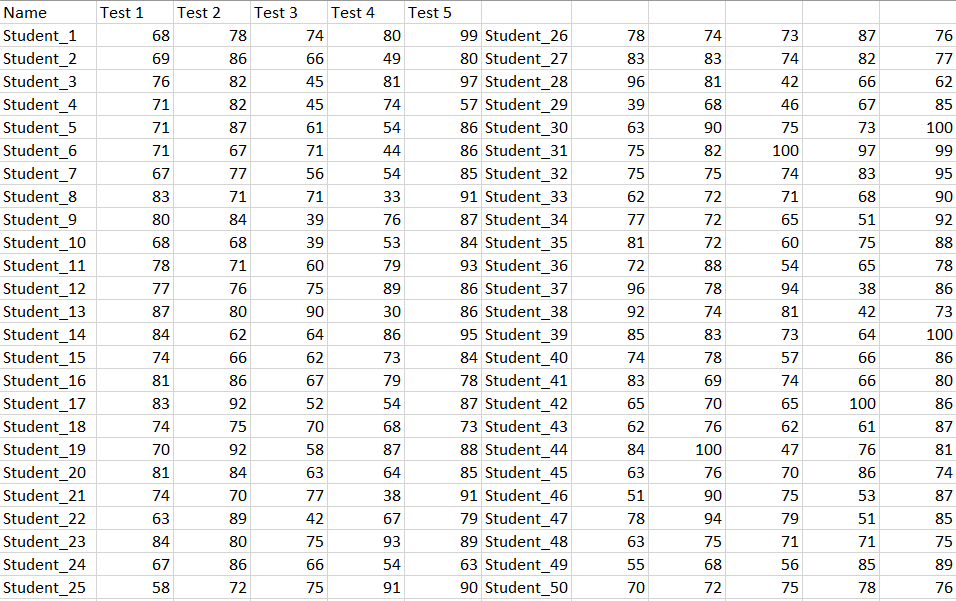
Where u is the mean and sigma is the standard deviation of the scores on the exam? This scale enables the instructor to assign a letter grade to each student for each exam. A student's letter grade will not be determined on a straight 90-80-70-60 scale. Instead, it will be assigned based on the cutoffs listed above, which depend on the mean and standard deviation of the students' average scores. The students' test scores are currently stored in an Excel file called test_scores.xlsx. You have to save that file as a tab-delimited file. You then have to read the file and process, compute, and print the final percentage and letter grades for each student. Your program must also compute the mean, standard deviation, minimum score, and maximum percentage score in the class, along with the most common grade and a count of how many of each letter grade were assigned.
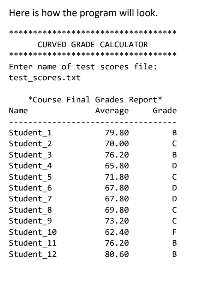
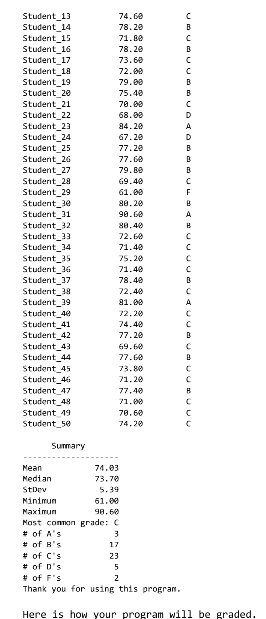
Here is how the program will look. CURVED GRADE CALCULATOR Enter name of test scores file: test_scores.txt *Course Final Grades Report Nane Average Grade Student 1 Student_2 Student 3 Student 4 Student 5 Student 6 Student 7 Student 8 Student 9 Student_10 Student_11 Student_12 79.80 78.00 76.20 65.80 71.80 67.80 67.80 69.80 73.20 62.40 76.20 30.60 74.60 78.29 71.80 78.20 73.60 72.33 79.00 75.40 70.be 34.20 67.29 77.20 77.60 79.80 Student_13 Student_14 Student_15 Student_16 Student_17 Student 18 Student_19 Student 20 Student 21 Student 22 Student_23 Student_24 Student_25 Student 26 Student 27 Student 29 Student_29 Student_2e Student_31 Student_32 Student 33 Student 34 Student_35 Student_36 Student_37 Student_18 Student_39 Student_40 Student 41 Student_42 Student 43 Student_44 Student 45 Student_45 Student 47 Student 48 Student 49 Student_50 69.40 61.69 88.20 90.Ge 88.40 72.60 71.40 25.20 71.40 78.49 72.40 81.62 22,20 74.40 77.20 69.50 77.6 71,20 77.40 71.00 78.60 74.20 Summary Mean 74.03 Median 73.70 Story 5.39 Minimum 61.09 Maximum 98.50 Most common grade: C # of A's # of B's # of C's # of n's # of F's Thank you for using this program. Here is how your program will be graded. ime Test 1 Test 2 Test 3 Test 4 Test 5 68 74 og og 76 69 49 77 76 74 67 42 46 75 100 62 85 100 73 82 97 99 74 95 88 79 78 89 Name Student_1 Student_2 Student 3 Student_4 Student_5 Student_6 Student_7 Student_8 Student 9 Student_10 Student_11 Student_12 Student_13 Student_14 Student_15 Student_16 Student_17 Student_18 Student_19 Student_20 Student_21 Student_22 Student_23 Student_24 Student_25 87 80 30 99 Student_26 80 Student_27 97 Student_28 57 Student_29 86 Student_30 86 Student_31 85 Student_32 91 Student_33 87 Student 34 84 Student_35 93 Student_36 86 Student_37 86 Student_38 95 Student_39 84 Student_40 78 Student_41 87 Student_42 73 Student_43 88 Student_44 85 Student_45 91 Student_46 79 Student_47 89 Student_48 63 Student_49 90 Student_50 42 81 73 86 73 100 86 80 86 73 79 69 74 66 100 83 54 70 76 61 87 100 81 74 87 85 63 84 75 67 86 56 85 89 72 75 54 91 72 75 76 Here is how the program will look. CURVED GRADE CALCULATOR Enter name of test scores file: test_scores.txt *Course Final Grades Report Nane Average Grade Student 1 Student_2 Student 3 Student 4 Student 5 Student 6 Student 7 Student 8 Student 9 Student_10 Student_11 Student_12 79.80 78.00 76.20 65.80 71.80 67.80 67.80 69.80 73.20 62.40 76.20 30.60 74.60 78.29 71.80 78.20 73.60 72.33 79.00 75.40 70.be 34.20 67.29 77.20 77.60 79.80 Student_13 Student_14 Student_15 Student_16 Student_17 Student 18 Student_19 Student 20 Student 21 Student 22 Student_23 Student_24 Student_25 Student 26 Student 27 Student 29 Student_29 Student_2e Student_31 Student_32 Student 33 Student 34 Student_35 Student_36 Student_37 Student_18 Student_39 Student_40 Student 41 Student_42 Student 43 Student_44 Student 45 Student_45 Student 47 Student 48 Student 49 Student_50 69.40 61.69 88.20 90.Ge 88.40 72.60 71.40 25.20 71.40 78.49 72.40 81.62 22,20 74.40 77.20 69.50 77.6 71,20 77.40 71.00 78.60 74.20 Summary Mean 74.03 Median 73.70 Story 5.39 Minimum 61.09 Maximum 98.50 Most common grade: C # of A's # of B's # of C's # of n's # of F's Thank you for using this program. Here is how your program will be graded. ime Test 1 Test 2 Test 3 Test 4 Test 5 68 74 og og 76 69 49 77 76 74 67 42 46 75 100 62 85 100 73 82 97 99 74 95 88 79 78 89 Name Student_1 Student_2 Student 3 Student_4 Student_5 Student_6 Student_7 Student_8 Student 9 Student_10 Student_11 Student_12 Student_13 Student_14 Student_15 Student_16 Student_17 Student_18 Student_19 Student_20 Student_21 Student_22 Student_23 Student_24 Student_25 87 80 30 99 Student_26 80 Student_27 97 Student_28 57 Student_29 86 Student_30 86 Student_31 85 Student_32 91 Student_33 87 Student 34 84 Student_35 93 Student_36 86 Student_37 86 Student_38 95 Student_39 84 Student_40 78 Student_41 87 Student_42 73 Student_43 88 Student_44 85 Student_45 91 Student_46 79 Student_47 89 Student_48 63 Student_49 90 Student_50 42 81 73 86 73 100 86 80 86 73 79 69 74 66 100 83 54 70 76 61 87 100 81 74 87 85 63 84 75 67 86 56 85 89 72 75 54 91 72 75 76
Step by Step Solution
There are 3 Steps involved in it

Get step-by-step solutions from verified subject matter experts