Question: In this exercise we add a (long run) fixed cost to the analysis. Suppose the production process for a firm is homothetic and has decreasing
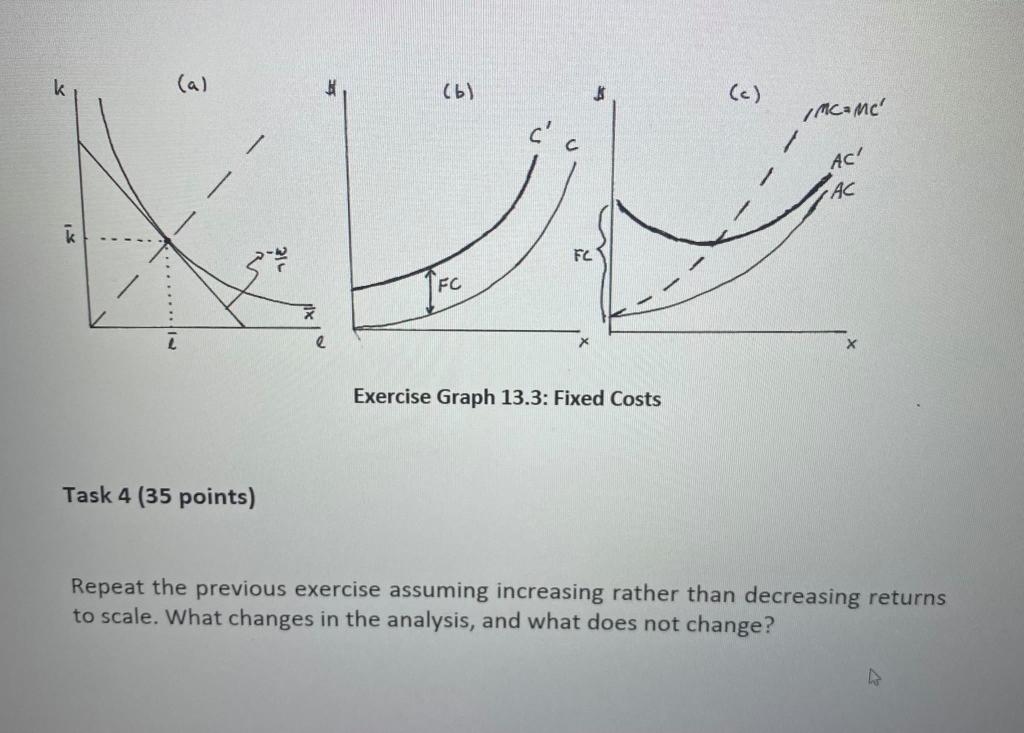
In this exercise we add a (long run) fixed cost to the analysis. Suppose the production process for a firm is homothetic and has decreasing re- turns to scale. a. On a graph with labor I on the horizontal and capital k on the vertical axis, draw an isoquant corresponding to output level x. For some wage rate w and rental rate r, indicate the cost minimizing input bundle for producing x. Answer: This is illustrated in panel (a) of Exercise Graph 13.3 where the input bundle (1, k) is the cost minimizing input bundle to produce x. (b) Indicate in your graph the slice of the production frontier along which all cost minimizing input bundles lie for this wage and rental rate. Answer: Since the production process is homothetic, all tangencies of isocosts with slope-w/r with isoquants for different output levels will lie on the ray emanating from the origin and passing through (1, k). This is also illustrated in panel (a) of Exercise Graph 13.3.D 1 c. In two separate graphs, draw the (total) cost curve and the average cost curve with the marginal cost curve. Answer: This is illustrated in panels (b) and (c) of Exercise Graph 13.3as C, AC and MC. Since the slice of the production frontier indicated by the dashed ray in panel (a) has decreasing returns, the shape of the cost function must be such that cost increases at an increasing rate as x goes up. The same then holds for AC, with the MC beginning at the same point as AC but lying above AC throughout. d. Suppose that, in addition to paying for labor and capital, the firm has to pay a recurring fixed cost (such as a license fee). What changes in your graphs? d. Suppose that, in addition to paying for labor and capital, the firm has to pay a recurring fixed cost (such as a license fee). What changes in your graphs? Answer: Nothing changes in panel (a) - because the fact that the firm has to pay some cost to begin producing does not change how much labor and capital will be needed to reach different isoquants. The cost curve, however, shifts up to c', with Cand c' parallel to each other and the difference being the FC. The marginal cost curve, however, remains unchanged since fixed costs do not enter the additional cost of producing output. Finally, the average cost curve moves up but, unlike the cost curve, not in a parallel fashion. It increases by the FC when x= 1 (be-cause the average fixed cost is FC/x). As x increases, however, FC/x falls - which causes the new average cost curve AC to converge to the original AC as x gets large. Finally, the average cost curve moves up but, unlike the cost curve, not in a parallel fashion. It increases by the FC when x = 1 (because the average fixed cost is FC/x). As x increases, however, FC/x falls which causes the new average cost curve AC to converge to the original AC as x gets large. e. What is the firm's exit price in the absence of fixed costs? What happens to that exit price when a fixed cost is added? Answer: In the absence of fixed costs, the firm's exit price is equal to the marginal cost of producing the first unit of output because that is where the marginal cost curve crosses the AC curve. When fixed costs are introduced, however, the exit price rises to the lowest point of the new U-shaped average cost curve AC where the unchanged MC curve crosses it. Thus, the exit price increases. f. Does the firm's supply curve shift as we add a fixed cost? Answer: No, the supply curve does not shift, but it does become shorter. It does not shift because the MC curve does not shift. It becomes shorter because the exit price increases. Thus, the supply curve before the introduction of the fixed cost is the entire MC curve in panel () of Exercise Graph 13.3, but after the FC is introduced, it shrinks to only the portion of the MC curve that lies above AC. g. Suppose that the cost minimizing input bundle for producing x that you graphed in part (a) is also the profit maximizing production plan before a fixed cost is considered. Will it still be the profit maximizing production plan after we include the fixed cost in our analysis? Answer: This will still be the profit maximizing production plan if it is optimal for the firm not to exit. In that case, price is sufficiently high relative to w and r such that it crosses MC above AC in panel (c) of Exercise Graph 13.3. However, it may be the case that the introduction of FC im- plies that it is no longer profit maximizing to produce - and that a corner solution of producing nothing is optimal. This occurs if the price falls be- low AC. () (E) () /mco Me Ac' . AC FC TEC Exercise Graph 13.3: Fixed Costs Task 4 (35 points) Repeat the previous exercise assuming increasing rather than decreasing returns to scale. What changes in the analysis, and what does not change


