

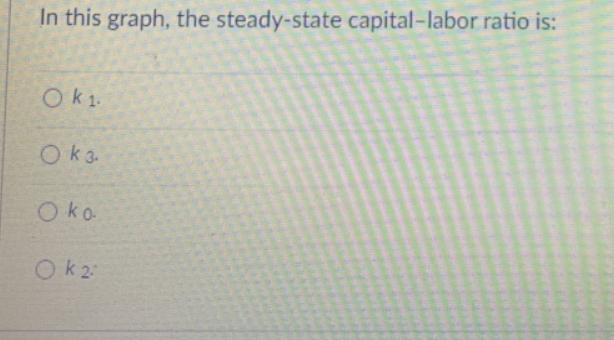
Question: In this graph, the steady-state capital-labor ratio is: O k 1. Ok 3. O ko Ok2 Exhibit: Steady-State Capital-Labor Ratio 8(k) y 4 ko
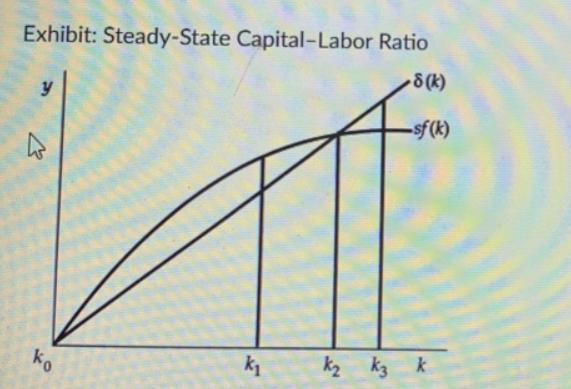
In this graph, the steady-state capital-labor ratio is: O k 1. Ok 3. O ko Ok2 Exhibit: Steady-State Capital-Labor Ratio 8(k) y 4 ko k -sf (k) k k3 k
Step by Step Solution
There are 3 Steps involved in it
1 Expert Approved Answer
Step: 1 Unlock

According to the graph the steadystate capitallabor ratio is k2 The ... View full answer
Question Has Been Solved by an Expert!
Get step-by-step solutions from verified subject matter experts
Step: 2 Unlock
Step: 3 Unlock