

Question: In this problem, you will be working with the function y = f(x) shown in the graph. The numbers indicate the areas of the
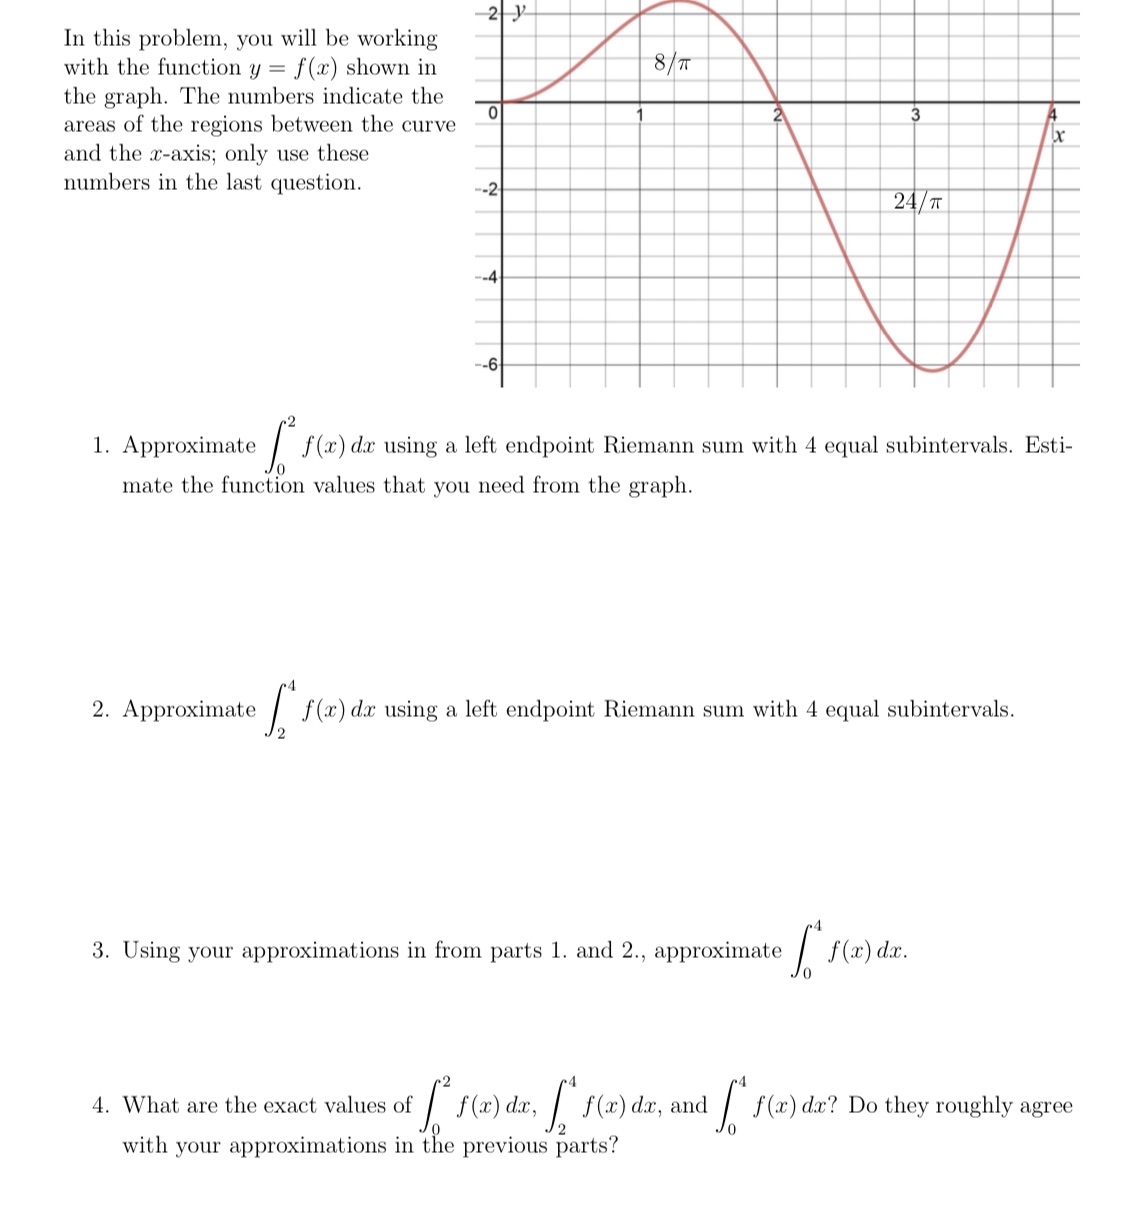
In this problem, you will be working with the function y = f(x) shown in the graph. The numbers indicate the areas of the regions between the curve and the x-axis; only use these 2y numbers in the last question. 8/ 0 --2 --4 --6 2 3 4 Xxx 24/ 1. Approximate for f(x) d using a left endpoint Riemann sum with 4 equal subintervals. Esti- mate the function values that you need from the graph. 2. Approximate f(x) dar using a left endpoint Riemann sum with 4 equal subintervals. 3. Using your approximations in from parts 1. and 2., approximate f(x) dx. of f(x) dr, f f(x)dr, and [ f(x) dr? Do they roughly agree 4. What are the exact values of with your approximations in the previous parts?
Step by Step Solution
There are 3 Steps involved in it

Get step-by-step solutions from verified subject matter experts