

Question: In this project, you ll be implementing and analyzing the behavior of three different routines: Merge sort; Quick sort; and Insertion sort. We re mainly
In this project, youll be implementing and analyzing the behavior of three different routines: Merge sort; Quick sort; and Insertion sort. Were mainly interested in comparing the number of comparisons each sort routine will take when sorting data of different sizes and different configurations. The program will include the following functions:
void ascendint A int N stores the numbers N in array A in an ascending man ner.
void descendint A int N stores the numbers N in array A in a descending man ner.
void veeint A int N stores the numbers N in array A in a V manner where the numbers decrease in the first half of the array and increases in the second half. For example, if N the numbers will be stored as
void zigzagint A int N stores the numbers N in array A in a zigzag manner where the largest number comes first, then the lowest, then the second largest, then the second lowest, and so on For example, if N the numbers will be stored as
void randomint A int N storesNrandomnumbersinarray A Therandomnumbers will be from the range N with repetition allowed.
long insertSortint A int N sorts the N elements in A an in ascending order using the insertion sort algorithm. Returns the total number of datarelated comparisons that were performed. datarelated means that comparison was between members of the A array.
long quickSortint A int N sorts the N elements in A in an ascending order using the quick sort algorithm. Returns the total number of datarelated comparisons that were performed. Use the last value in the list as the pivot.
long mergeSortint A int N sorts the N elements in A an in ascending order using the merge sort algorithm. Returns the total number of datarelated comparisons that were performed
Input Format Your program will perform one or more sorting runs For each run, well specify the size of the data, how to generate the input data, and which sorting routine to use. Your program will read the details of the runs from a control file The name of the control file will be specified as a commandline argument to your program. The first line of the control file is an integer R indicating the number of runs specified in that control file. R lines will follow the first, with each line describing a specific run. Each run will be specified using three fields separated by one or more spaces
The first field is an integer N representing the size of the data for that run, where
Thesecond field is a letter indicating the type of input data: Aascending, Ddescending, Vvee, Zzigzag, Rrandom.
The third field is a letter indicating the sorting algorithm to be used in this run: Qquick, Mmerge, Iinsert.
Output Format For each run your program will print to the screen a line of four fields. The first three fields are the same as the input fields for that run. The fourth field is the number of comparisons made by the sorting routine for that run. Data Collection
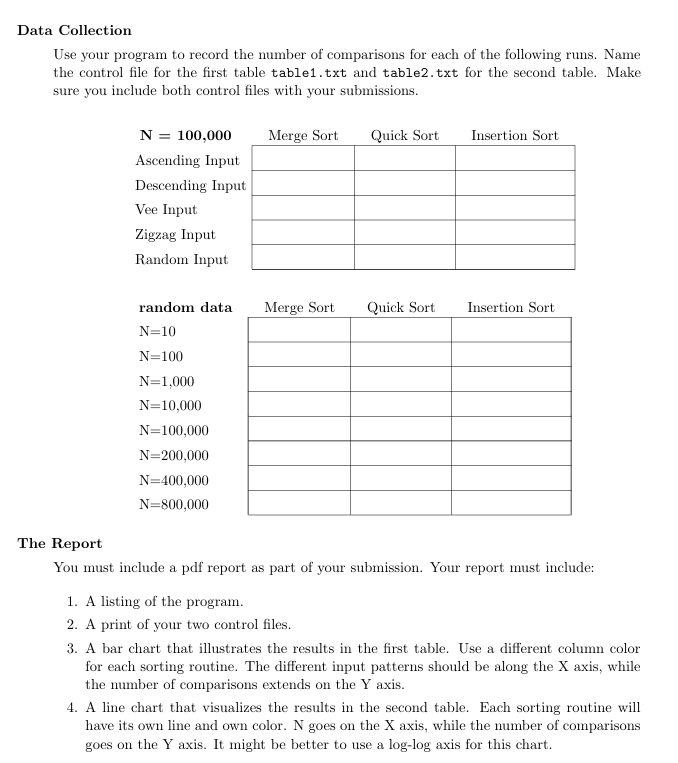
Use your program to record the number of comparisons for each of the following runs. Name the control file for the first table tabletxt and tabletxt for the second table. Make sure you include both control files with your submissions.
mathrmN
Ascending Input
Descending Input
Vee Input
Zigzag Input
Random Input
random data
mathrmN
mathrmN
mathrmN
mathrmN
N
N
N
N
The Report
You must include a pdf report as part of your submission. Your report must include:
A listing of the program.
A print of your two control files.
A bar chart that illustrates the results in the first table. Use a different column color for each sorting routine. The different input patterns should be along the X axis, while the number of comparisons extends on the Y axis.
A line chart that visualizes the results in the second table. Each sorting routine will have its own line and own color. N goes on the X axis, while the number of comparisons goes on the Y axis. It might be better to use a loglog axis for this chart.
Step by Step Solution
There are 3 Steps involved in it
1 Expert Approved Answer
Step: 1 Unlock

Question Has Been Solved by an Expert!
Get step-by-step solutions from verified subject matter experts
Step: 2 Unlock
Step: 3 Unlock