

Question: In this project you will learn to create graph visualizations using tools such as GraphViz, R, etc. 1. (30 points) Create the FIFA World Cup
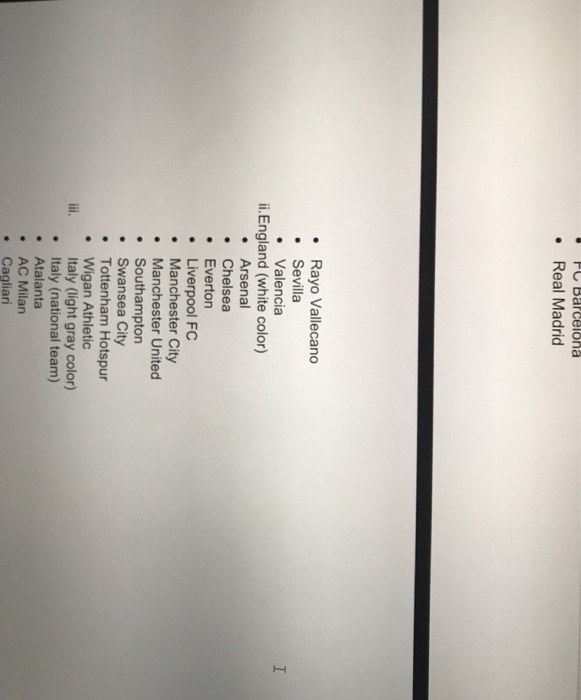
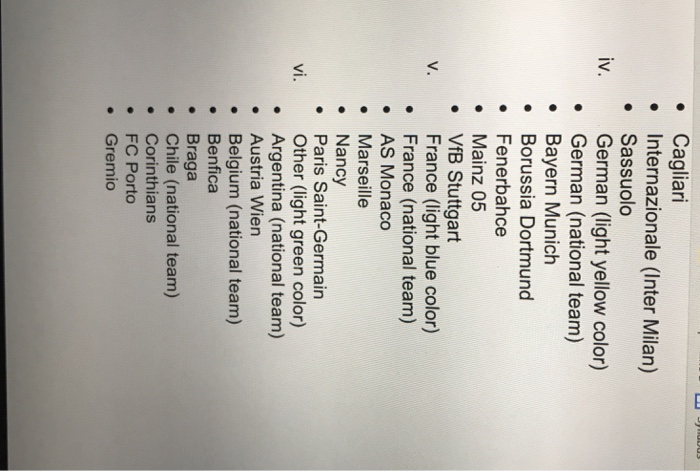
In this project you will learn to create graph visualizations using tools such as GraphViz, R, etc. 1. (30 points) Create the FIFA World Cup 2018 bracket (last 16 teams) using GraphViz. An example of the bracket can be found here. You can find many such brackets online. a. Your bracket doesn't have to look exactly like the bracket in the example but should include the countries' names and scores. For information on GraphViz, visit this page. b. 2. (50 points) This Business Insider article lists the 20 best football(soccer) coaches in the world. Suppose you are asked to create a network visualization to be part of this article. a. b. c. Each coach should be presented as a node of one shape (e.g. a circle). Use igraph in R to create the network visualization. For more information, check out this web page Your visualization must show the connections between each coach and all the clubs he is associated with Each club should be presented as a node of another shape (e.g. a box). The association between a coach and a club should be presented as a directed link (with arrow) pointing from the coach node to the club node. d. If the coach is currently working for a club, the link between them should be a solid line. If the coach worked for a club previously, the link between them should be a dashed line. 3 e. The node for each team (or club) should be filled with colored based on their countries. For example, the clubs in the Spain and its national team should use the same fill color. For simplicity we divide the team into the following groups: i. Spain (light red color) Spain (national team) . Athletic Bilbao Atletico Madrid . Espanyol In this project you will learn to create graph visualizations using tools such as GraphViz, R, etc. 1. (30 points) Create the FIFA World Cup 2018 bracket (last 16 teams) using GraphViz. An example of the bracket can be found here. You can find many such brackets online. a. Your bracket doesn't have to look exactly like the bracket in the example but should include the countries' names and scores. For information on GraphViz, visit this page. b. 2. (50 points) This Business Insider article lists the 20 best football(soccer) coaches in the world. Suppose you are asked to create a network visualization to be part of this article. a. b. c. Each coach should be presented as a node of one shape (e.g. a circle). Use igraph in R to create the network visualization. For more information, check out this web page Your visualization must show the connections between each coach and all the clubs he is associated with Each club should be presented as a node of another shape (e.g. a box). The association between a coach and a club should be presented as a directed link (with arrow) pointing from the coach node to the club node. d. If the coach is currently working for a club, the link between them should be a solid line. If the coach worked for a club previously, the link between them should be a dashed line. 3 e. The node for each team (or club) should be filled with colored based on their countries. For example, the clubs in the Spain and its national team should use the same fill color. For simplicity we divide the team into the following groups: i. Spain (light red color) Spain (national team) . Athletic Bilbao Atletico Madrid . Espanyol
Step by Step Solution
There are 3 Steps involved in it

Get step-by-step solutions from verified subject matter experts