

Question: In this question you must estimate a time series model for value added tax (VAT) collections, for South Africa. You are provided with the
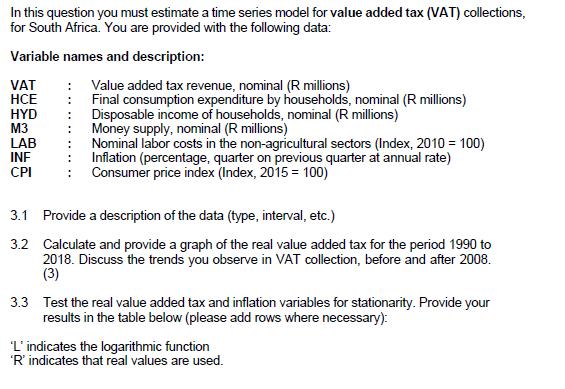
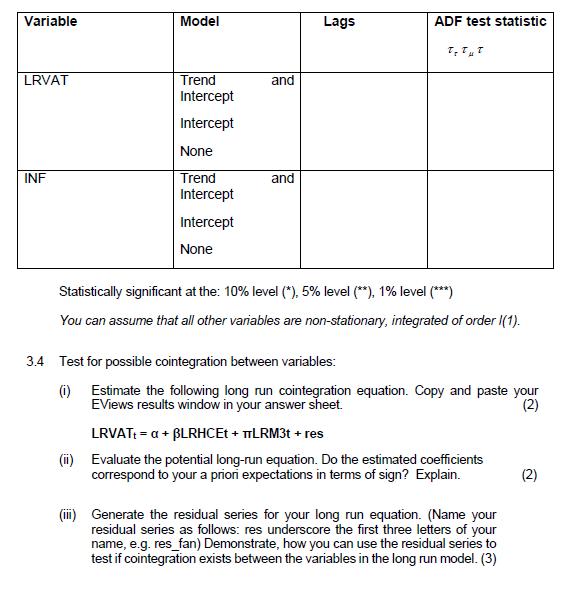
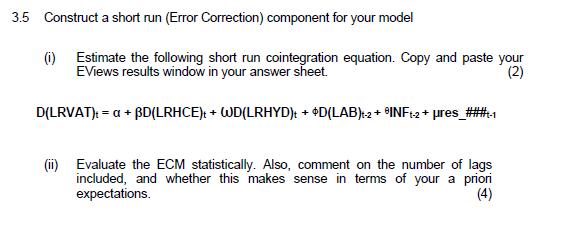
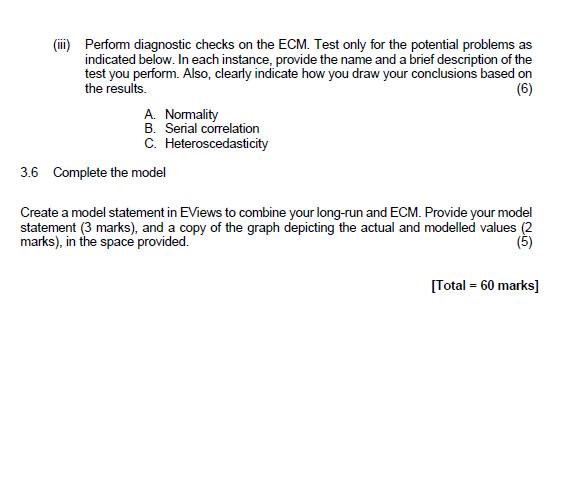
In this question you must estimate a time series model for value added tax (VAT) collections, for South Africa. You are provided with the following data: Variable names and description: : Value added tax revenue, nominal (R millions) Final consumption expenditure by households, nominal (R millions) Disposable income of households, nominal (R millions) Money supply, nominal (R millions) VAT HCE : HYD : : M3 LAB : : INF CPI Nominal labor costs in the non-agricultural sectors (Index, 2010 = 100) Inflation (percentage, quarter on previous quarter at annual rate) : Consumer price index (Index, 2015 = 100) 3.1 Provide a description of the data (type, interval, etc.) 3.2 Calculate and provide a graph of the real value added tax for the period 1990 to 2018. Discuss the trends you observe in VAT collection, before and after 2008. (3) 3.3 Test the real value added tax and inflation variables for stationarity. Provide your results in the table below (please add rows where necessary): 'L' indicates the logarithmic function 'R' indicates that real values are used. Variable LRVAT INF Model Trend Intercept Intercept None Trend Intercept Intercept None and and Lags ADF test statistic 3.4 Test for possible cointegration between variables: (i) T. TUT Statistically significant at the: 10% level (*), 5% level (**), 1% level (***) You can assume that all other variables are non-stationary, integrated of order (1). Estimate the following long run cointegration equation. Copy and paste your EViews results window in your answer sheet. (2) LRVAT+ = a + BLRHCET +TLRM3t + res (ii) Evaluate the potential long-run equation. Do the estimated coefficients correspond to your a priori expectations in terms of sign? Explain. (iii) Generate the residual series for your long run equation. (Name your residual series as follows: res underscore the first three letters of your name, e.g. res_fan) Demonstrate, how you can use the residual series to test if cointegration exists between the variables in the long run model. (3) N 3.5 Construct a short run (Error Correction) component for your model (i) Estimate the following short run cointegration equation. Copy and paste your EViews results window in your answer sheet. (2) D(LRVAT):= a + BD(LRHCE)t + WD(LRHYD)t + $D(LAB)+2+ INF+2+ res_###-1 (ii) Evaluate the ECM statistically. Also, comment on the number of lags included, and whether this makes sense in terms of your a priori expectations. (4) (iii) Perform diagnostic checks on the ECM. Test only for the potential problems as indicated below. In each instance, provide the name and a brief description of the test you perform. Also, clearly indicate how you draw your conclusions based on the results. (6) A. Normality B. Serial correlation C. Heteroscedasticity 3.6 Complete the model Create a model statement in EViews to combine your long-run and ECM. Provide your model statement (3 marks), and a copy of the graph depicting the actual and modelled values (2 marks), in the space provided. (5) [Total = 60 marks]
Step by Step Solution
3.48 Rating (155 Votes )
There are 3 Steps involved in it
31 Description of the data The data provided is quarterly data for the period 1990 to 2018 The variables are all in real terms meaning that they have been adjusted for inflation 32 Graph of real value ... View full answer

Get step-by-step solutions from verified subject matter experts