

Question: In which graph below are the selected points the right endpoints of the 4 approximationg rectangles? O A. O B. Ay Ay 8- 6- 4-
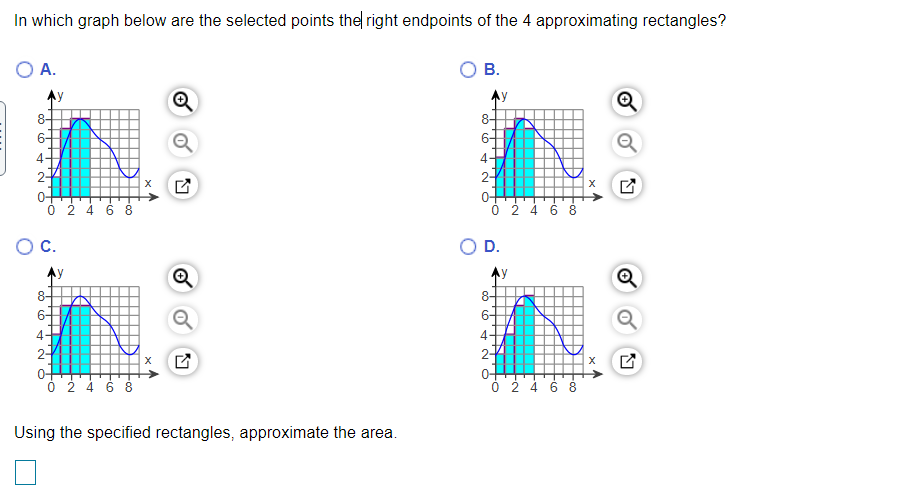
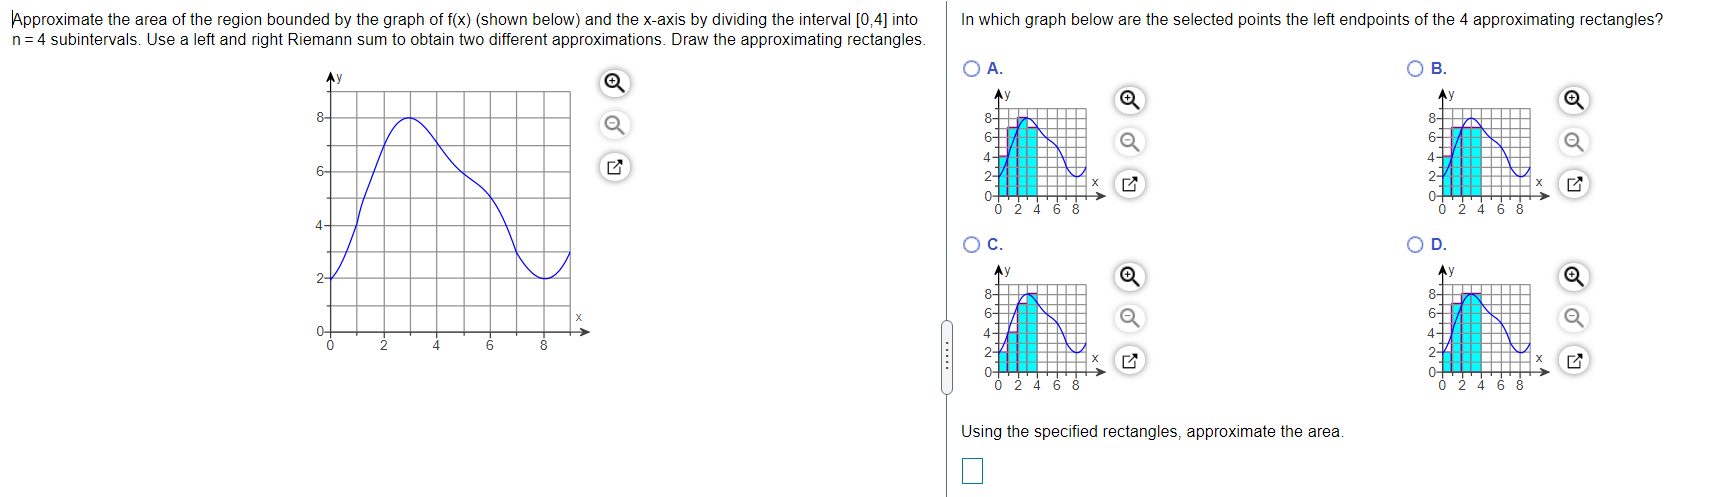
In which graph below are the selected points the right endpoints of the 4 approximationg rectangles? O A. O B. Ay Ay 8- 6- 4- X X 0 4 8 O C. OD. Ay Ay 6- 4- 2- X X 0 246 8 Using the specified rectangles, approximate the area.Approximate the area of the region bounded by the graph of f(x) (shown below) and the x-axis by dividing the interval [0,4] into In which graph below are the selected points the left endpoints of the 4 approximationg rectangles? n = 4 subintervals. Use a left and right Riemann sum to obtain two different approximations. Draw the approximationg rectangles. O A. O B. Ay 8- No X 2 6 2 O C. OD. 2- Q 8- 6 CO- . . . . . 0 2 4 6 8 Using the specified rectangles, approximate the area
Step by Step Solution
There are 3 Steps involved in it

Get step-by-step solutions from verified subject matter experts