

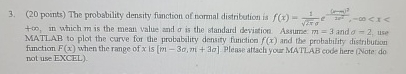
Question: + , in which m is the mean value and is the standard deviation. Assume m = 3 and = 2 use MATLAB to plot
in which is the mean value and is the standard deviation. Assume and use MATLAB to plot the curve for the probabality density function and the probability distribution finction when the range of is Please altach your MATLAB code here Note do not use EXCEL
Step by Step Solution
There are 3 Steps involved in it
1 Expert Approved Answer
Step: 1 Unlock

Question Has Been Solved by an Expert!
Get step-by-step solutions from verified subject matter experts
Step: 2 Unlock
Step: 3 Unlock