

Question: In your report's Results section: Based on temperature and pressure data, mark the seven relevant states and plot the ideal cycle on the attached l
In your report's "Results" section:
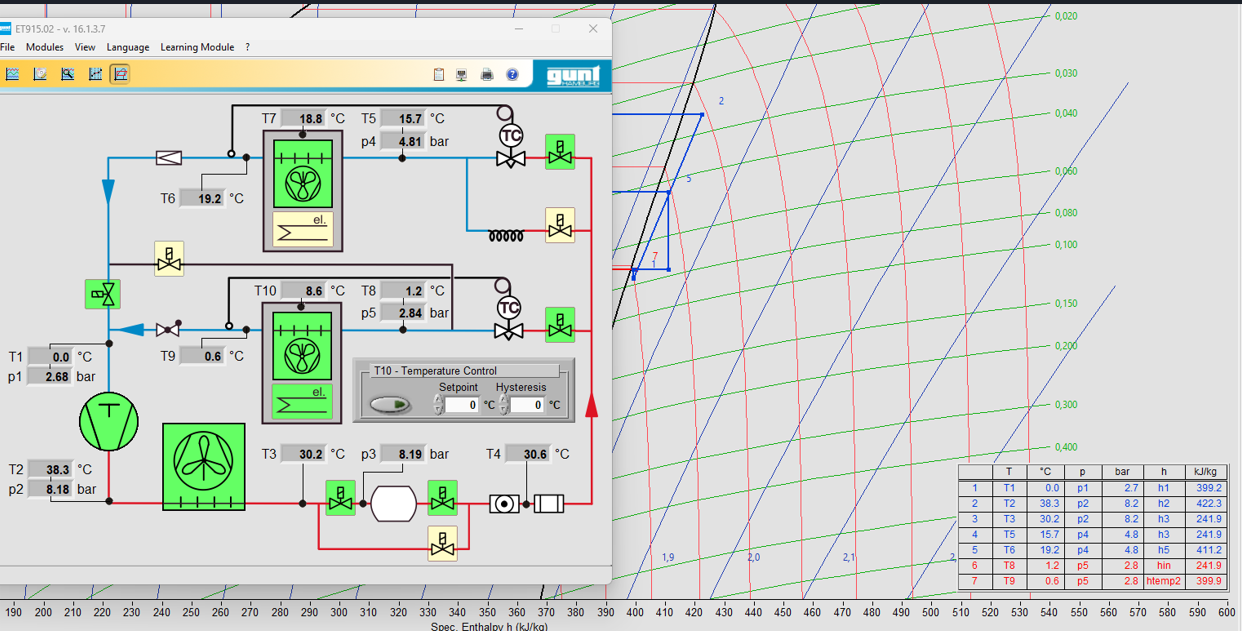
Based on temperature and pressure data, mark the seven relevant states and plot the ideal
cycle on the attached diagram for Tests I and II see Fig. b for guidance Determine all
corresponding enthalpies from the same diagram.
Clearly present the following data in a tabular format:
Test I : Temperatures T T T T T pressures P P P P enthalpies h h h h h
Test II: Temperatures T T T T T pressures P P P P enthalpies h h h h h
Include a picture of your entire diagram that shows the cycles with two different colors.
ET v
Modules View Language Learning Module
Step by Step Solution
There are 3 Steps involved in it
1 Expert Approved Answer
Step: 1 Unlock

Question Has Been Solved by an Expert!
Get step-by-step solutions from verified subject matter experts
Step: 2 Unlock
Step: 3 Unlock