

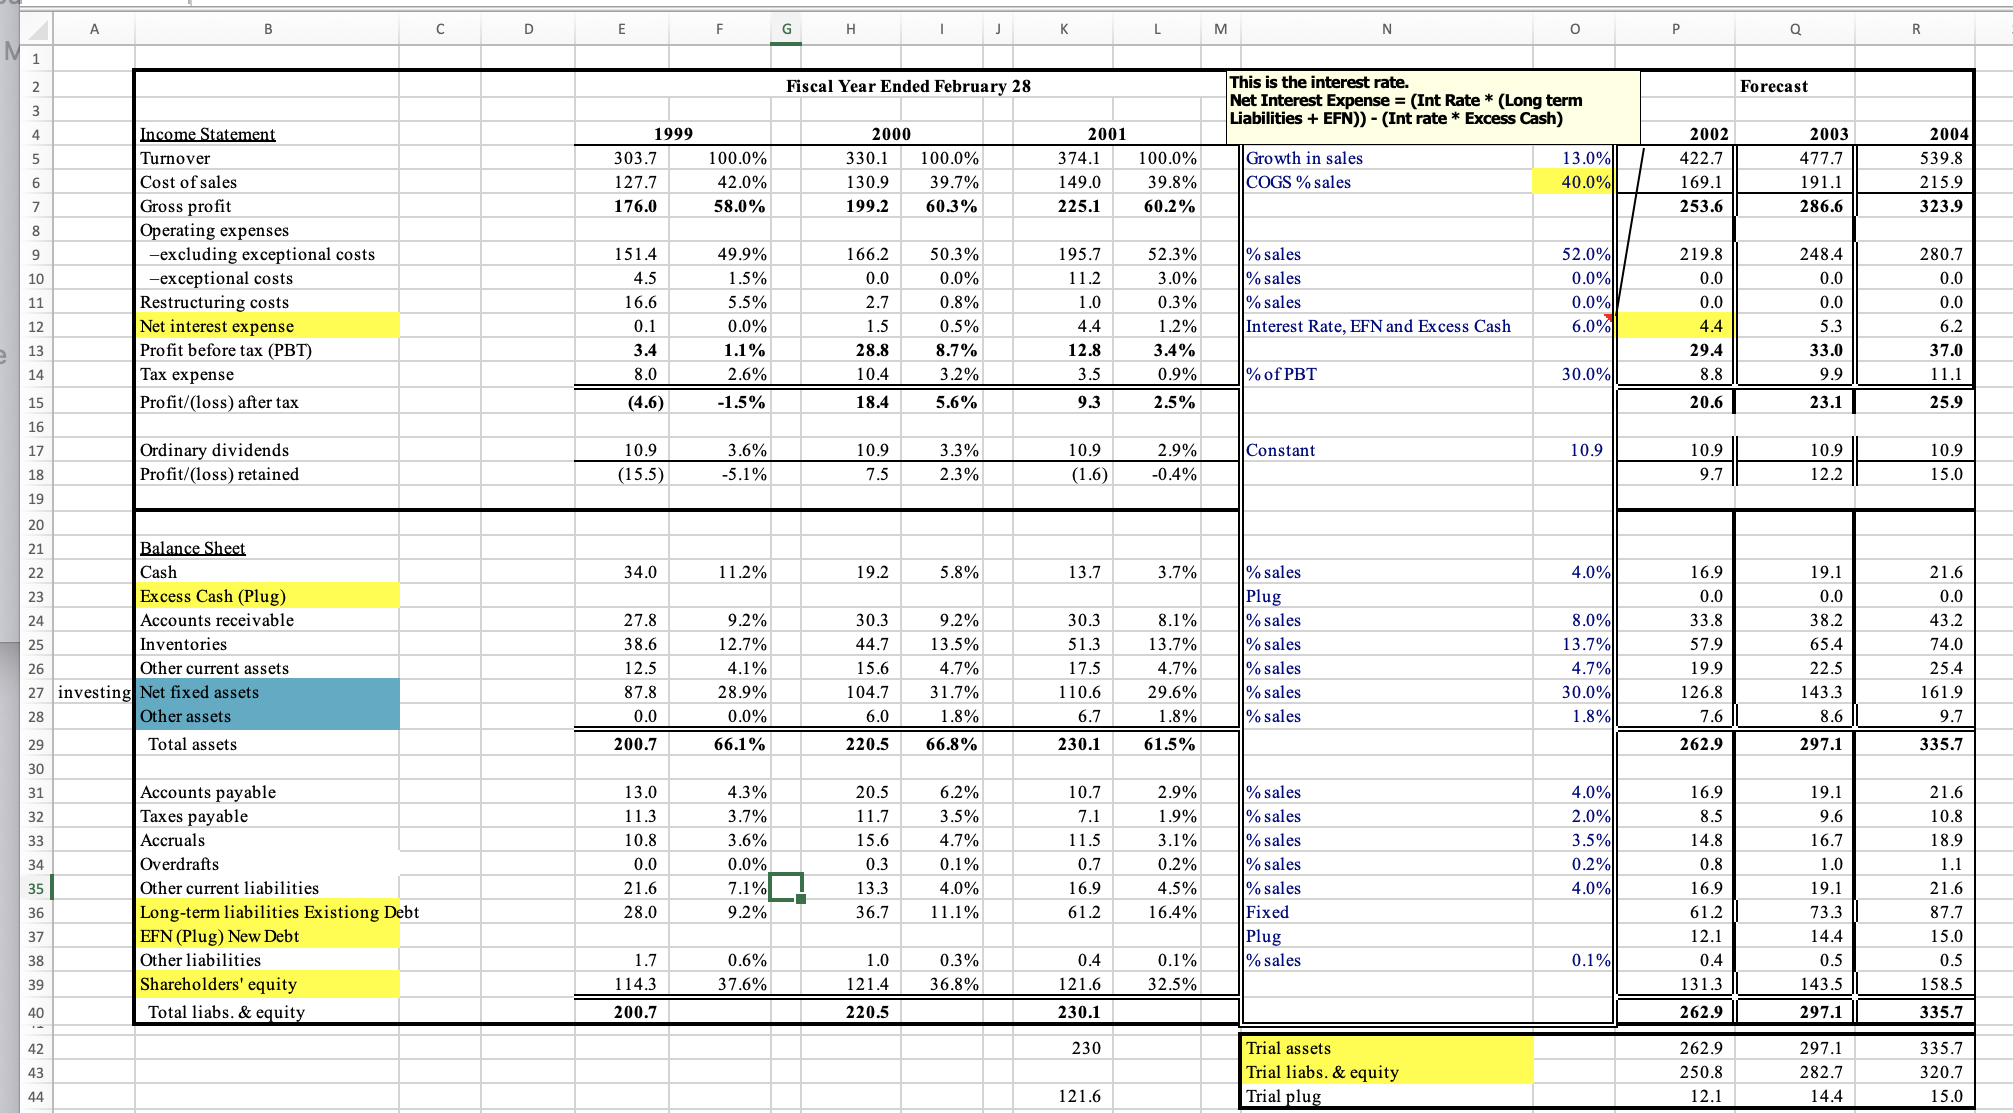
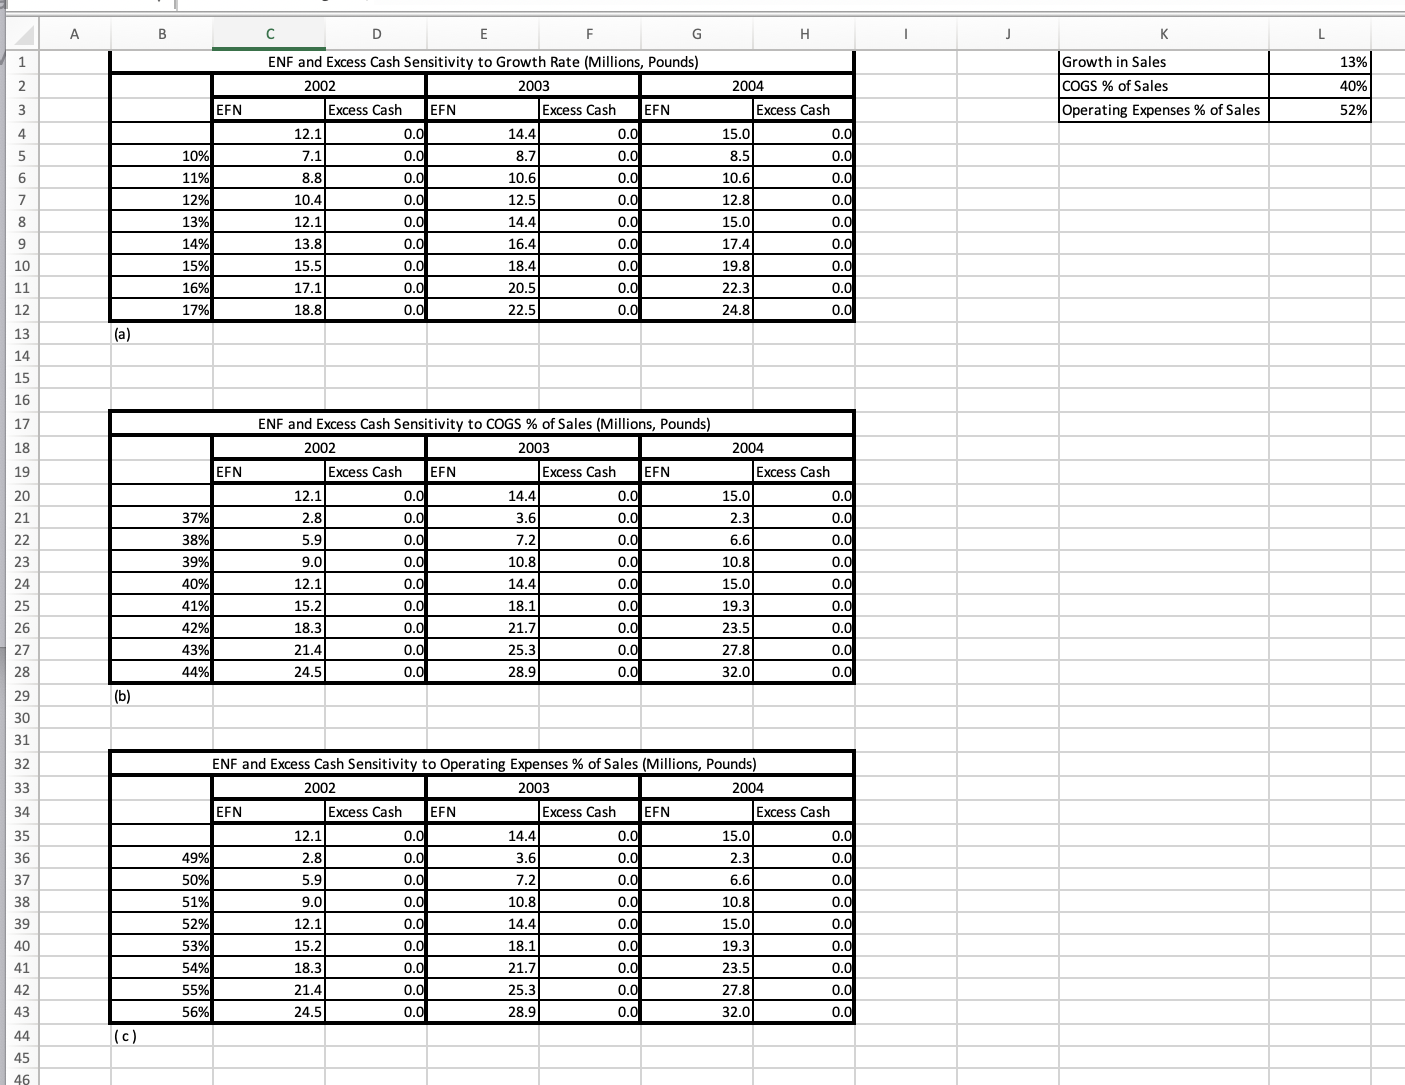
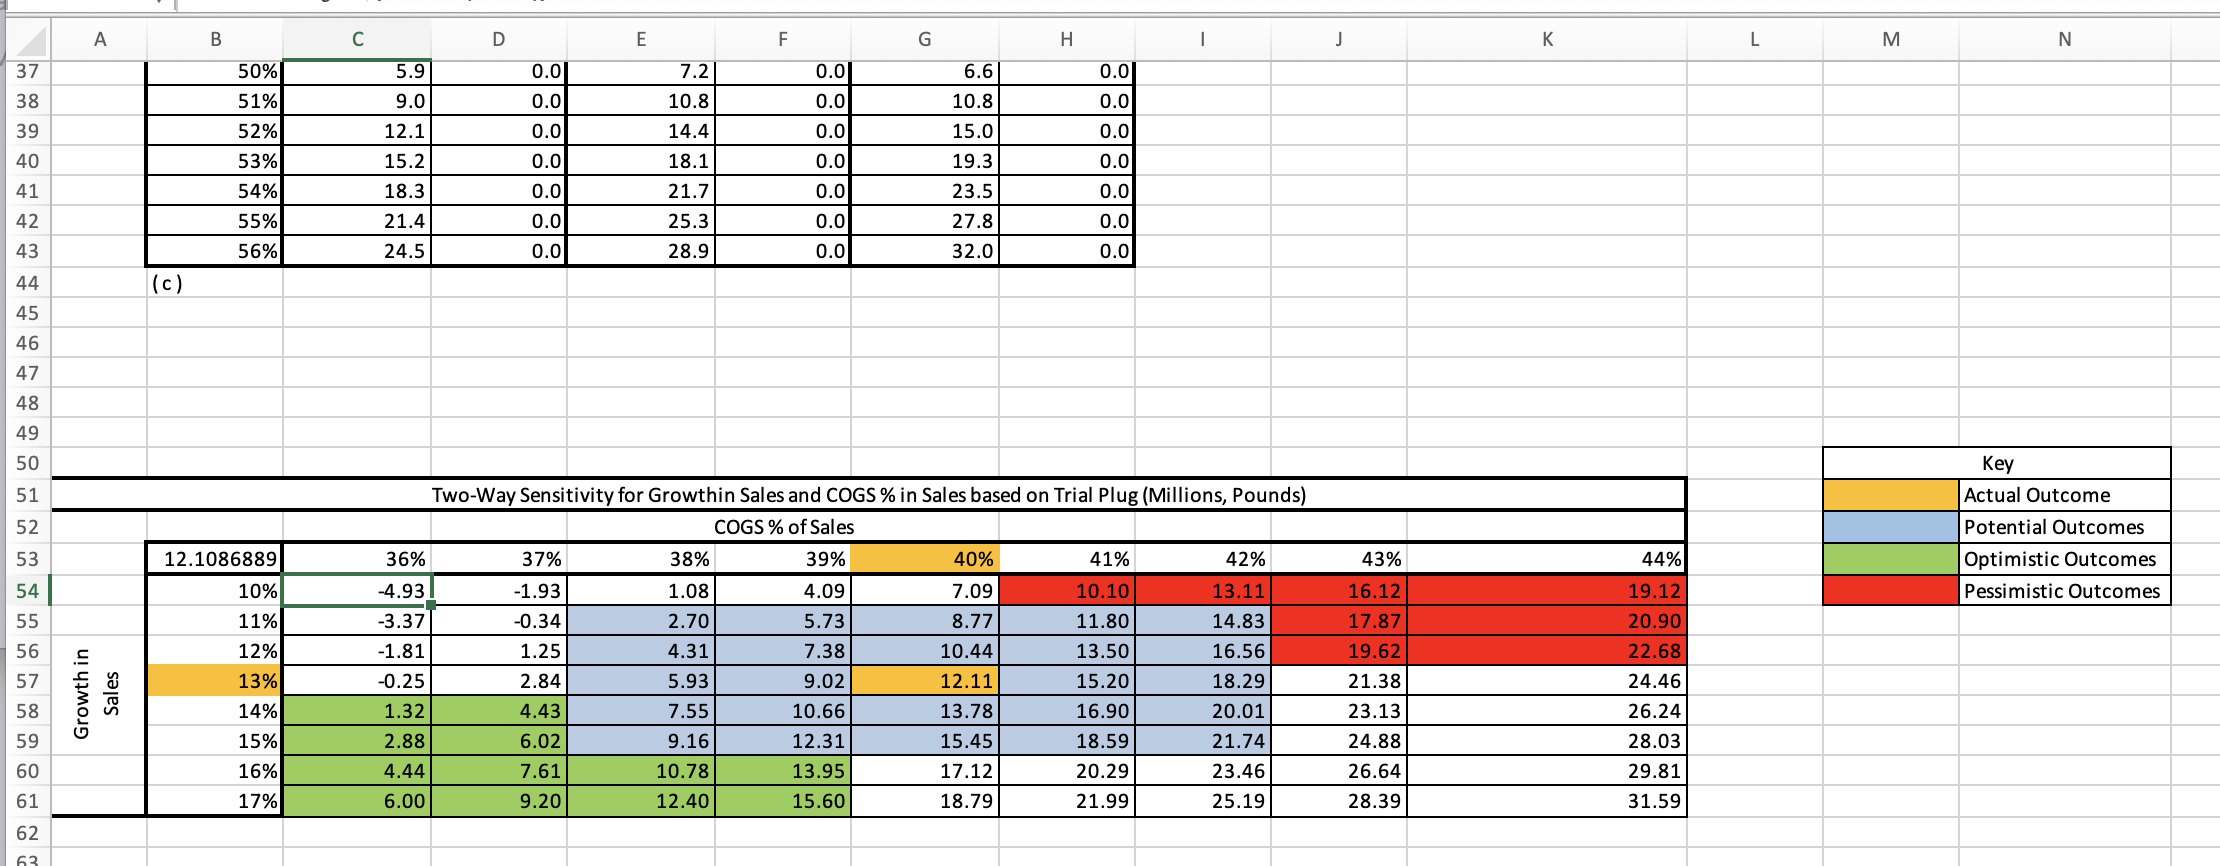
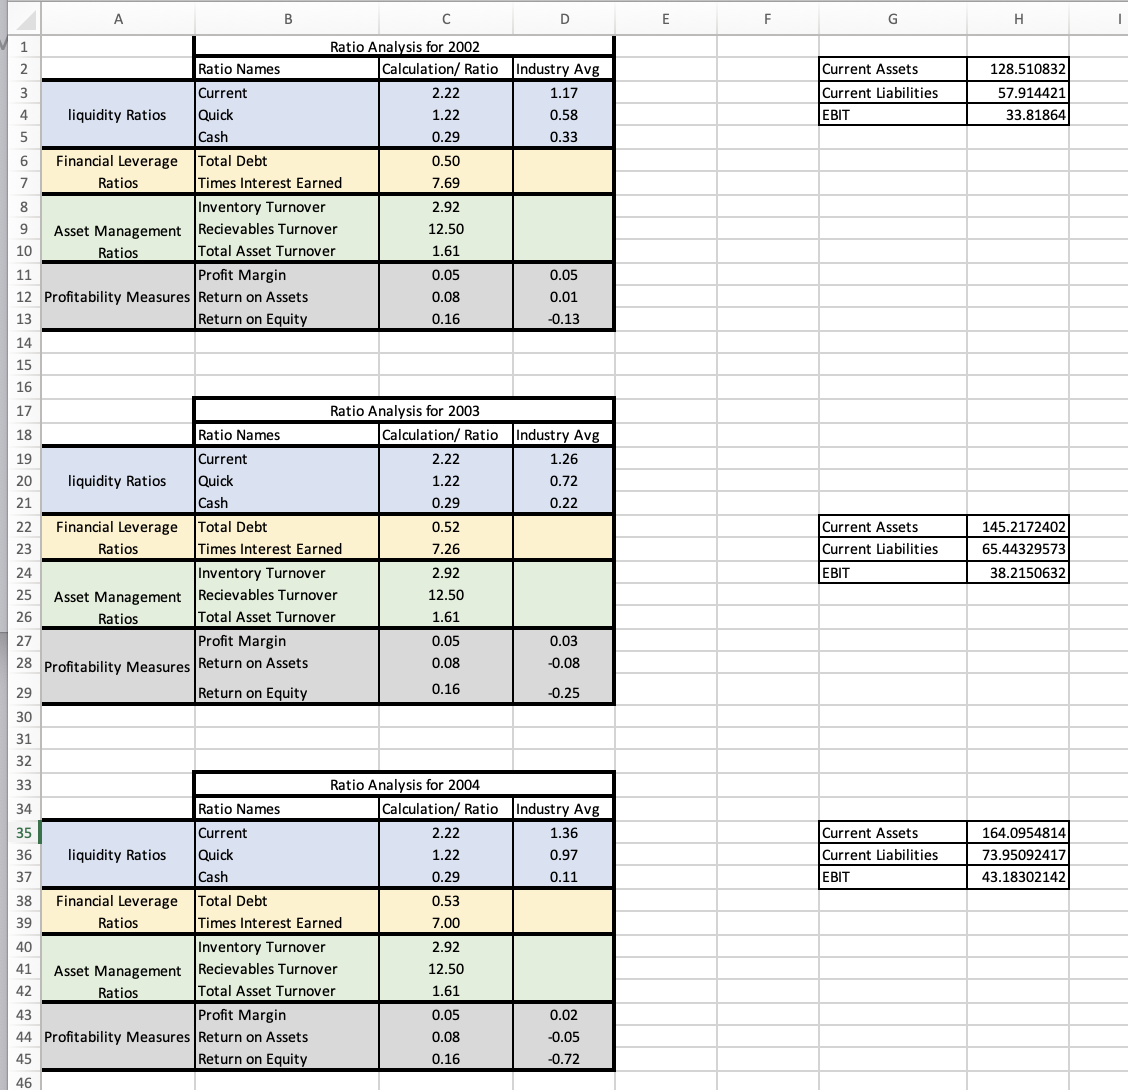
Include a detailed description for what each tables means from the data below. Need to know what
Fantastic news! We've Found the answer you've been seeking!
Question:
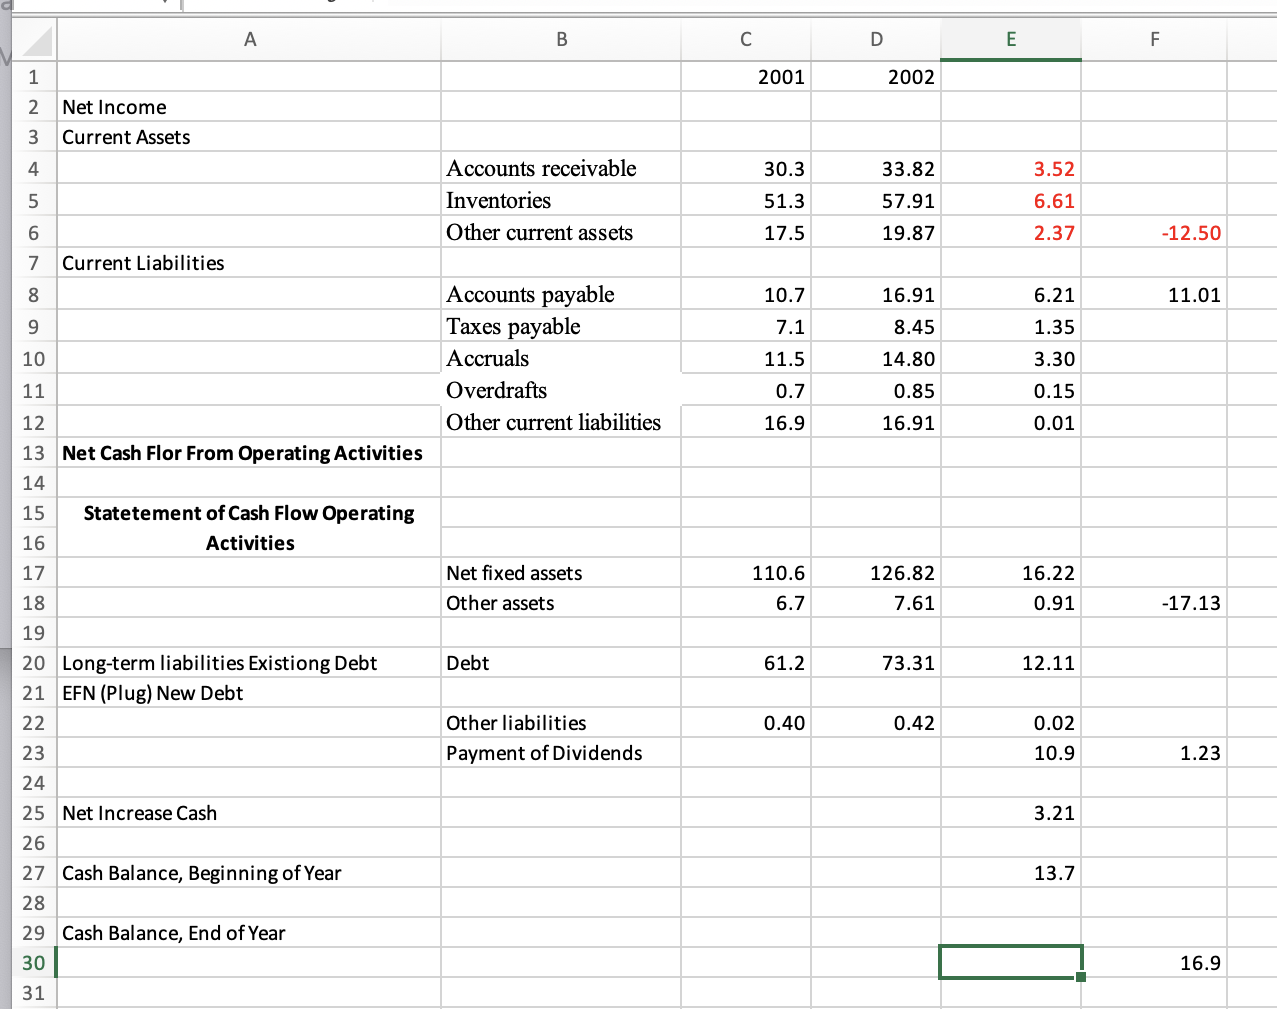
Include a detailed description for what each tables means from the data below. Need to know what the number represent on each table and a description on the difference between the three years. was It positive, negative or is there something the company has to work on?
Expert Answer:

Related Book For 

Project Management A Systems Approach to Planning Scheduling and Controlling
ISBN: 978-0470278703
10th Edition
Authors: Harold Kerzner
Posted Date:
