

Question: Include in your report ( follow directions given in bullet point ) A title page. This handout. Simulink block diagram. Make sure Lodkup tables we
Include in your reportfollow directions given in bullet point
A title page.
This handout.
Simulink block diagram. Make sure Lodkup tables we louded before printing
Report the integration method and time interval if fixed that you used in your simulation.
The output of your program equivalent to Figures &C varied for each of the five cases in part
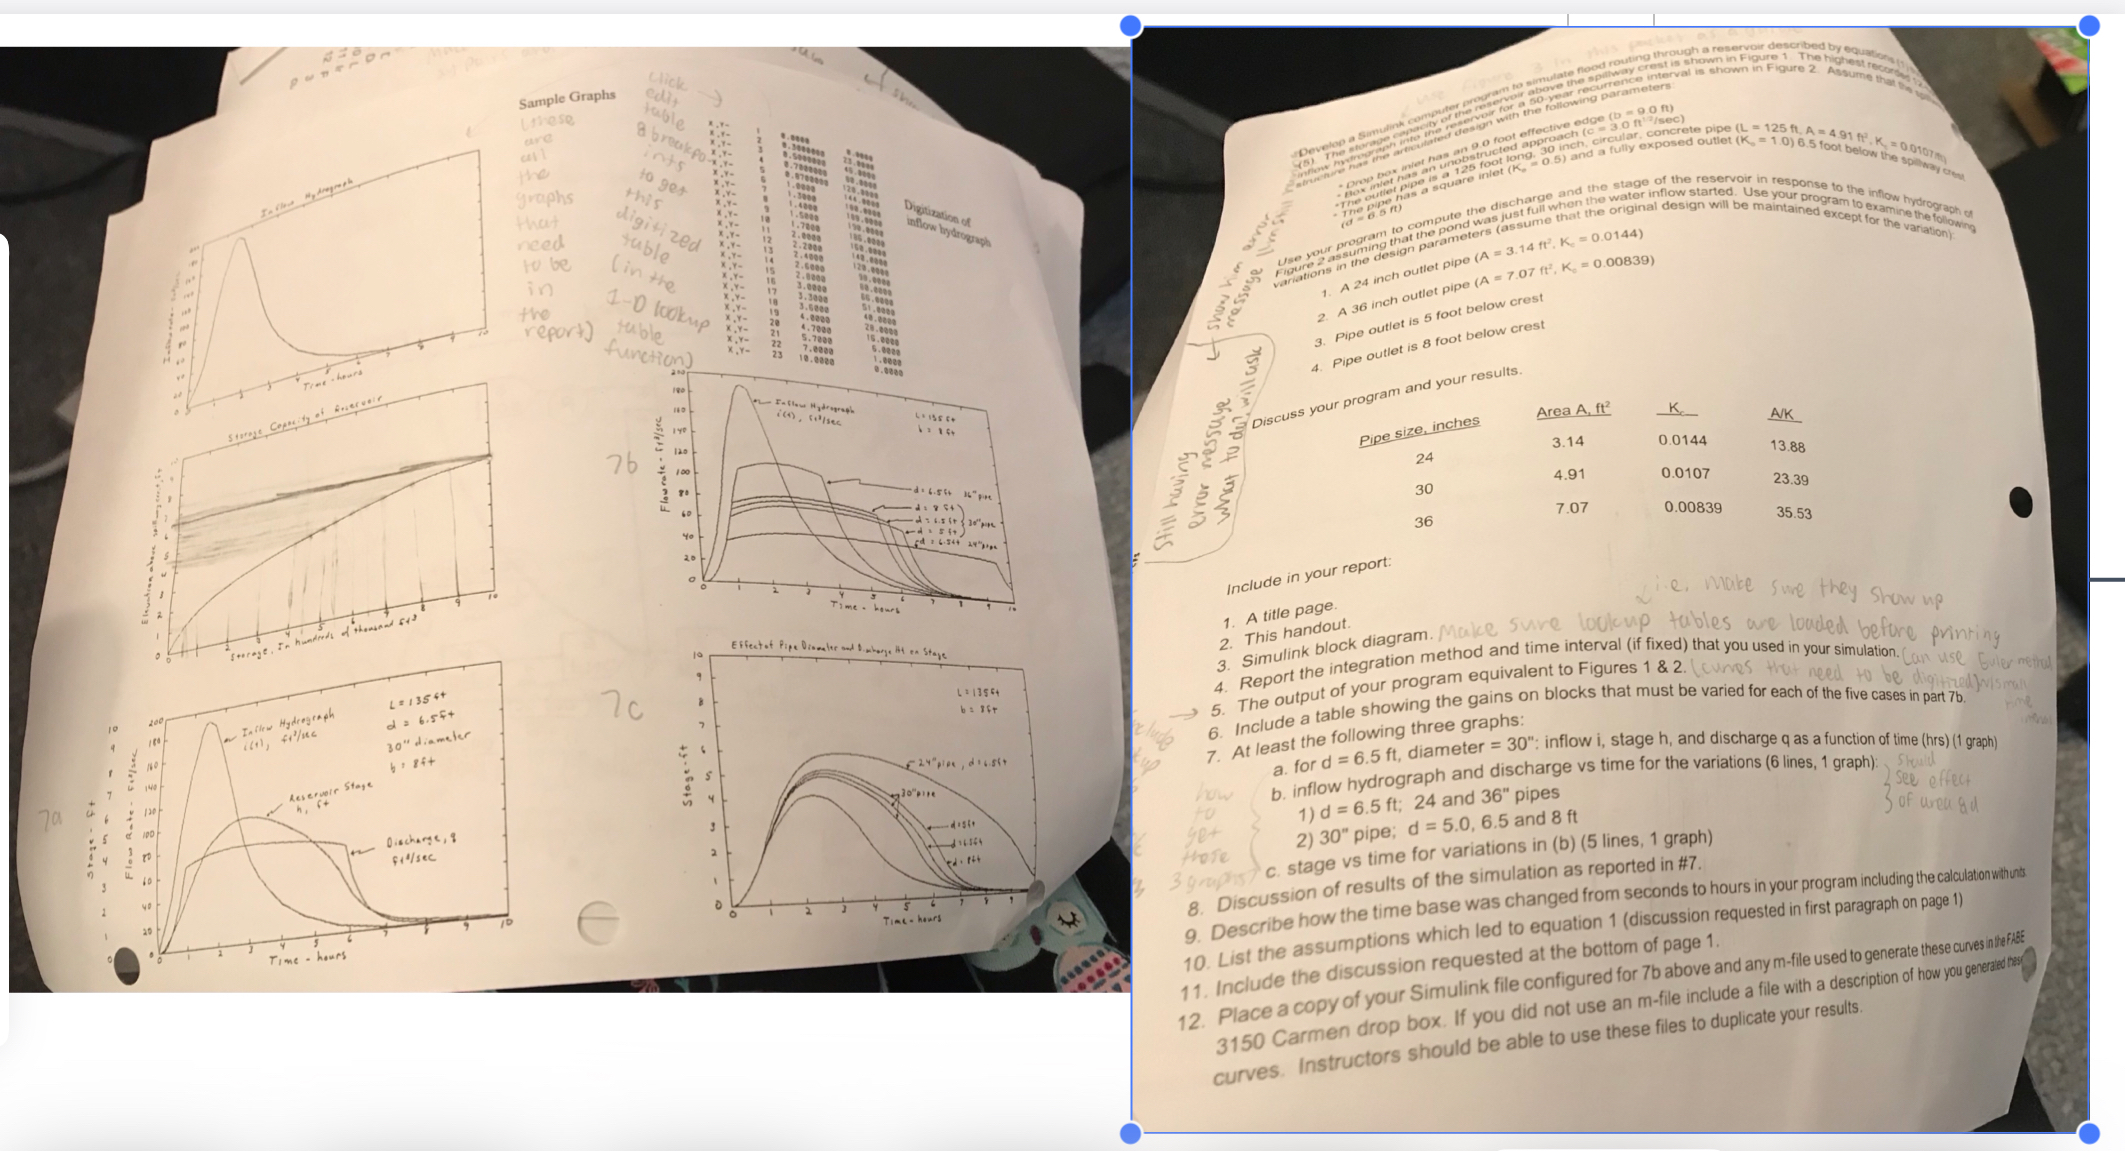
Include the following three graphs:
At a for diameter : inflow stage and discharge as a function of time hrs graph
b inflow hydrograph and discharge vs time for the variations lines, graph
; and pipes
pipe; and
there
c stage vs time for variations in b lines, graph
Discussion of results of the simulation as reported in #
Describe how the time base was changed from seconds to hours in your program including the calualaton whth uts
List the assumptions which led to equation discussion requested in first paragraph on page
Include the discussion requested at the botlom of page
Place a copy of your Simulink file configured for b above and any mfile used to generate these cumes nhtefflf Carmen drop box. If you did not use an mfile include a file with a description of how you generedec ony? curves. Instructors should be able to use these files to duplicate your results.
Please use the info in the following photos to create a block diagram and code that will correctly produce all graphs. I will dislike any answer that does not produce ALL five graphs.
Step by Step Solution
There are 3 Steps involved in it
1 Expert Approved Answer
Step: 1 Unlock

Question Has Been Solved by an Expert!
Get step-by-step solutions from verified subject matter experts
Step: 2 Unlock
Step: 3 Unlock