

Question: Include references 1. Read the attached pdf file (PSTYE 2003) below. Describe the psychological profiling (PSYTE) clustering system. Select an industry, other than restaurants, and
Include references
1. Read the attached pdf file (PSTYE 2003) below. Describe the psychological profiling (PSYTE) clustering system. Select an industry, other than restaurants, and explain how the software can be used for that industry.
2) What are the major differences in site location for a restaurant versus a retail store versus a manufacturing plant?
3) Red Lobster also defines its trade areas based on market size and population density. On page 363, you'll find Red Lobster seven density classes table displayed under question 3. The majority (92%) of the Red Lobster restaurant fall into three of these classes in the table. Which three classes do you think the chain has the most restaurant in? and explain Why?
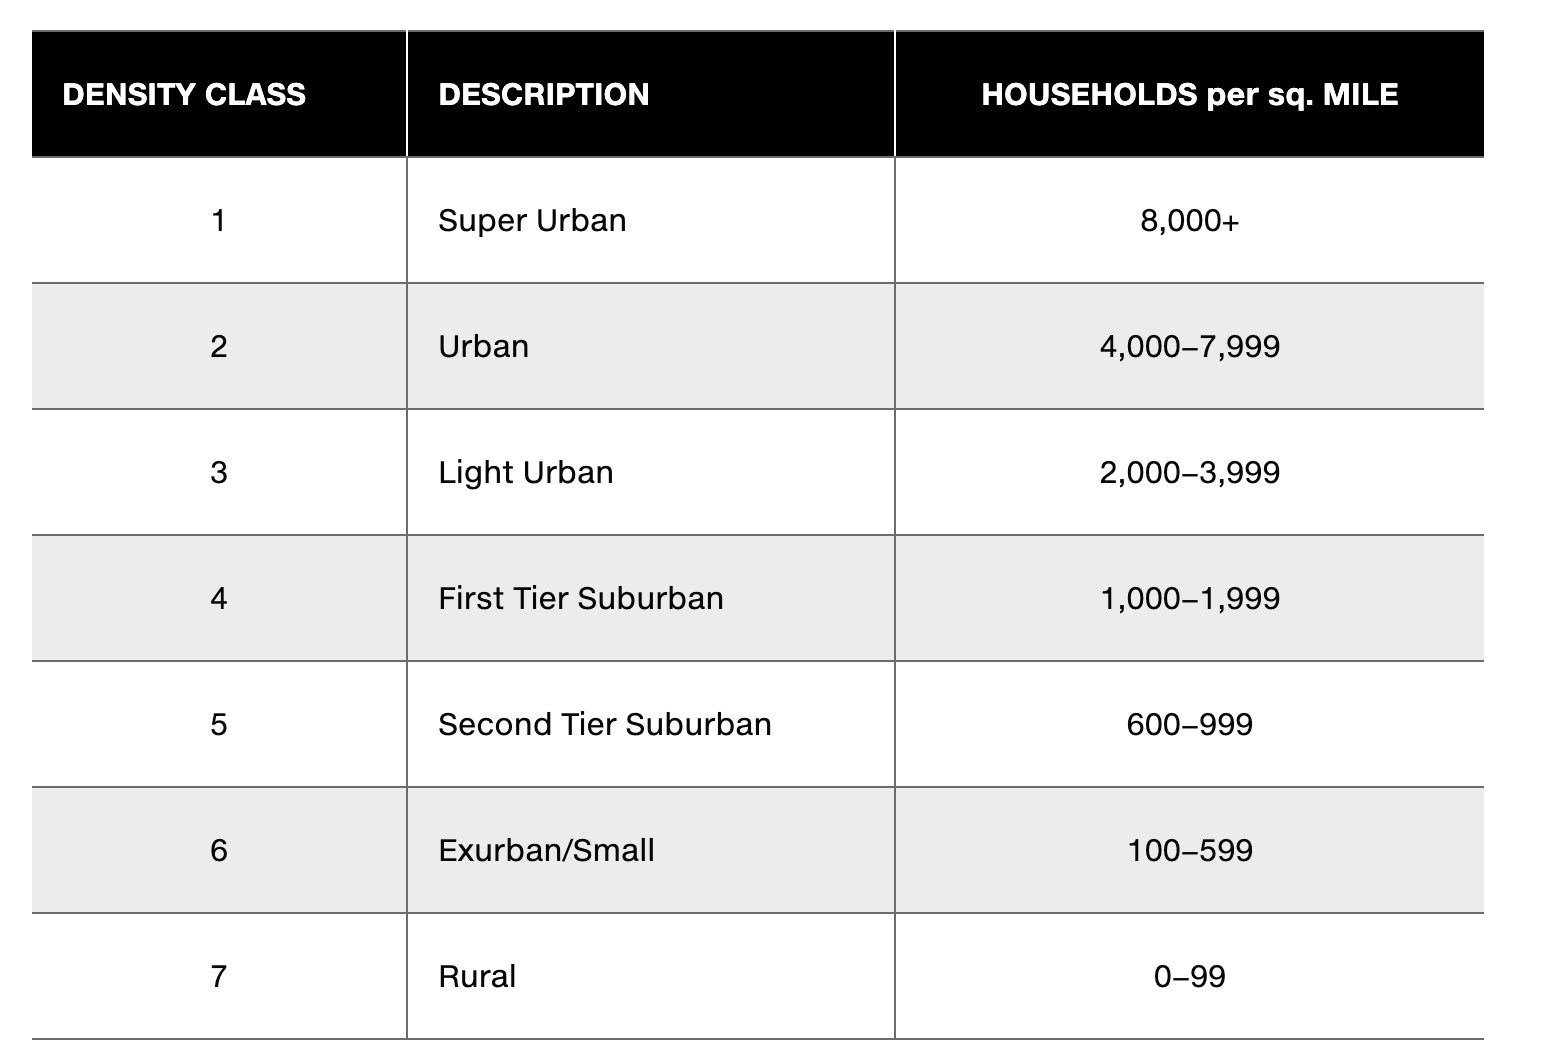
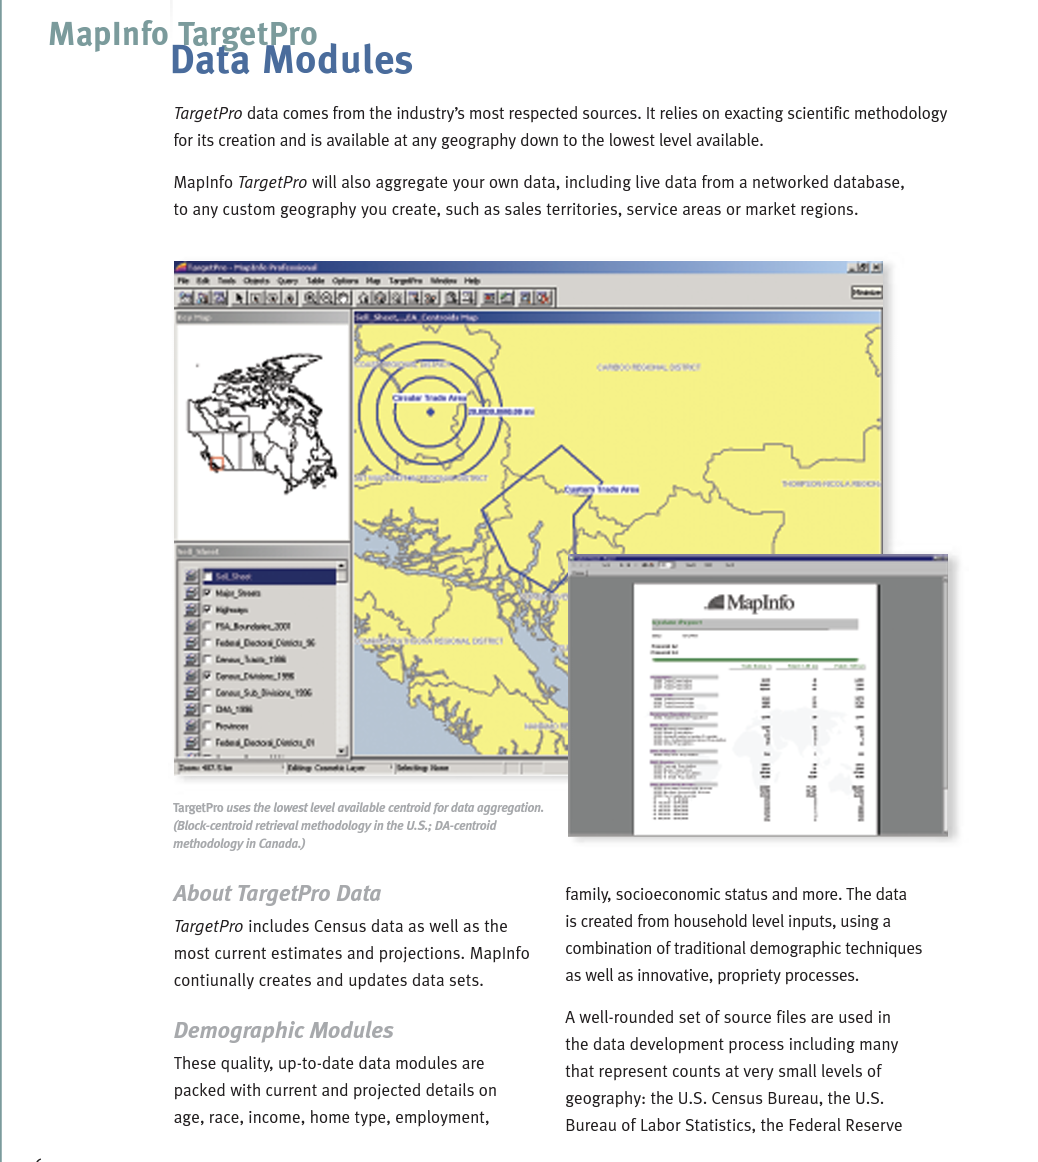
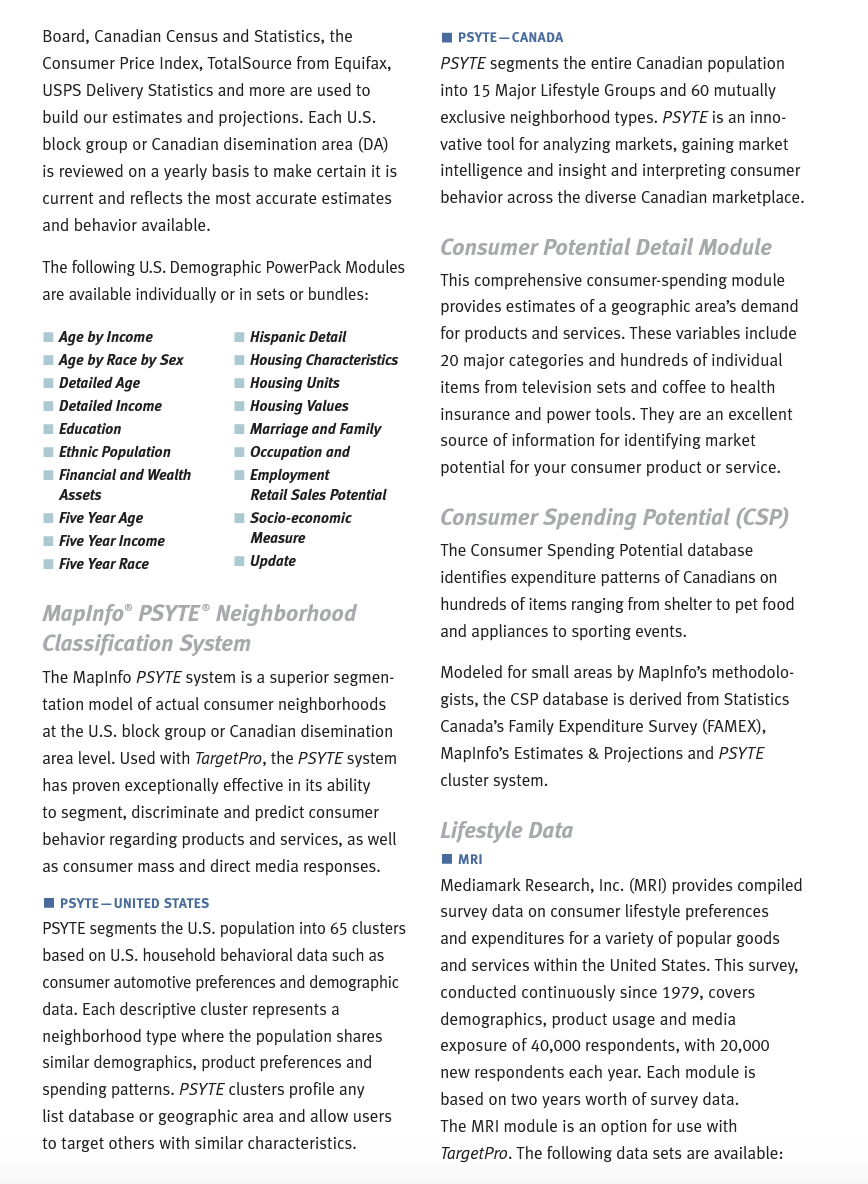
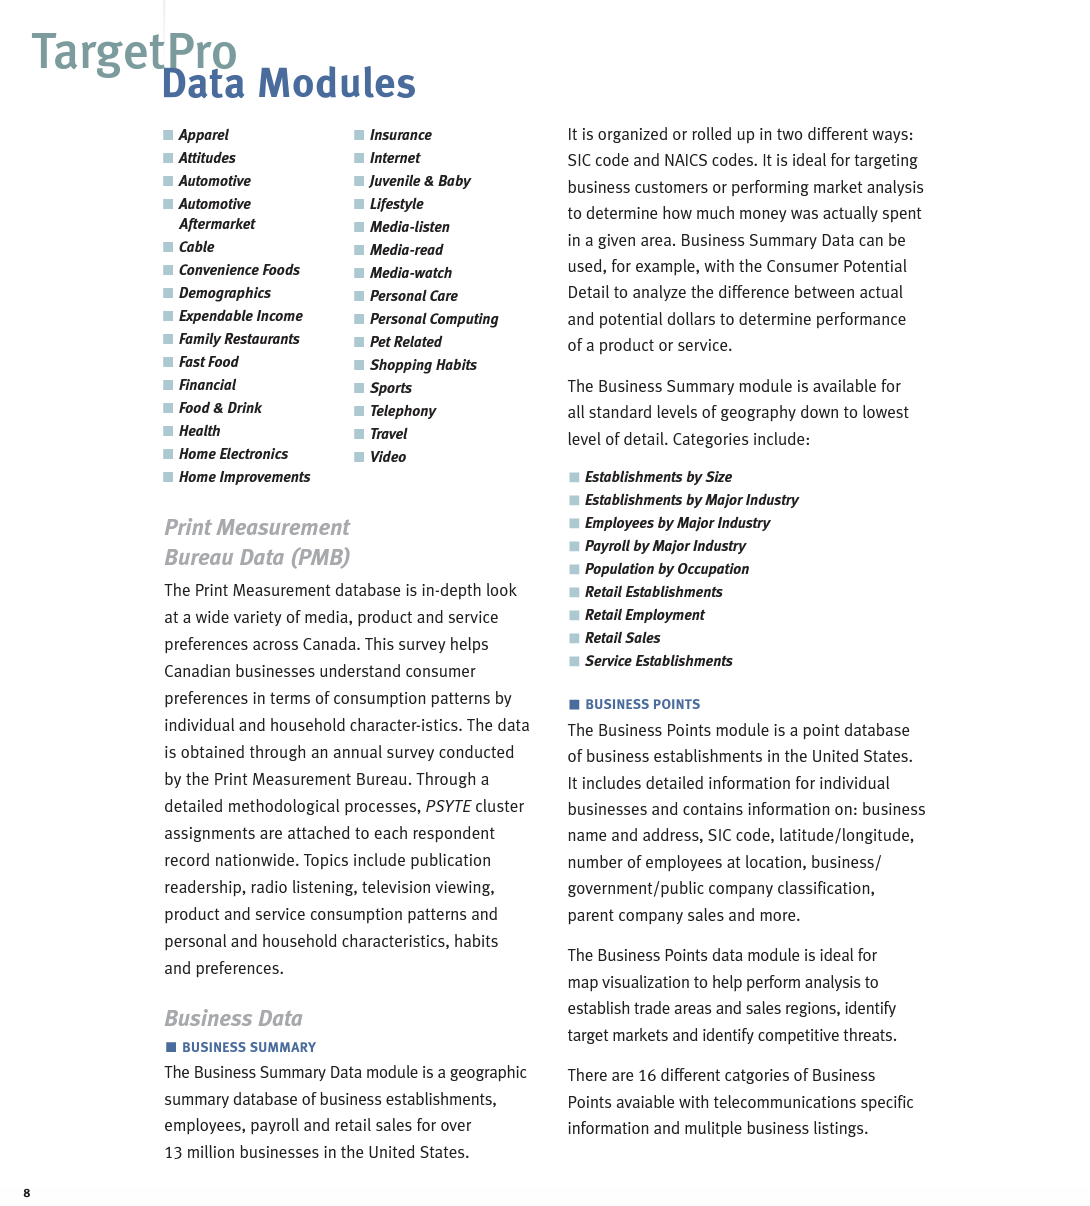
Dro ApparelAttitudesAutomotiveAutomotiveAftermarketCableConvenienceFoodsDemographicsExpendableIncomeFamilyRestaurantsFastFoodFinancialFood&DrinkHealthHomeElectronicsHomeImprovementsInsuranceInternetJuvenile&BabyLifestyleMedia-listenMedia-readMedia-watchPersonalCarePersonalComputingPetRelatedShoppingHabitsSportsTelephonyTravelVideo Print Measurement Bureau Data (PMB) The Print Measurement database is in-depth look at a wide variety of media, product and service preferences across Canada. This survey helps Canadian businesses understand consumer preferences in terms of consumption patterns by individual and household character-istics. The data is obtained through an annual survey conducted by the Print Measurement Bureau. Through a detailed methodological processes, PSYTE cluster assignments are attached to each respondent record nationwide. Topics include publication readership, radio listening, television viewing, product and service consumption patterns and personal and household characteristics, habits and preferences. Business Data BUSINESS SUMMARY The Business Summary Data module is a geographic summary database of business establishments, employees, payroll and retail sales for over 13 million businesses in the United States. It is organized or rolled up in two different ways: SIC code and NAICS codes. It is ideal for targeting business customers or performing market analysis to determine how much money was actually spent in a given area. Business Summary Data can be used, for example, with the Consumer Potential Detail to analyze the difference between actual and potential dollars to determine performance of a product or service. The Business Summary module is available for all standard levels of geography down to lowest level of detail. Categories include: Establishments by Size Establishments by Major Industry Employees by Major Industry Payroll by Major Industry Population by Occupation Retail Establishments Retail Employment Retail Sales Service Establishments BUSINESS POINTS The Business Points module is a point database of business establishments in the United States. It includes detailed information for individual businesses and contains information on: business name and address, SIC code, latitude/longitude, number of employees at location, business/ government/public company classification, parent company sales and more. The Business Points data module is ideal for map visualization to help perform analysis to establish trade areas and sales regions, identify target markets and identify competitive threats. There are 16 different catgories of Business Points avaiable with telecommunications specific information and mulitple business listings. DataretPro Modules TargetPro data comes from the industry's most respected sources. It relies on exacting scientific methodology for its creation and is available at any geography down to the lowest level available. MapInfo TargetPro will also aggregate your own data, including live data from a networked database, to any custom geography you create, such as sales territories, service areas or market regions. methodology in Canada.) About TargetPro Data TargetPro includes Census data as well as the most current estimates and projections. MapInfo contiunally creates and updates data sets. Demographic Modules These quality, up-to-date data modules are packed with current and projected details on age, race, income, home type, employment, family, socioeconomic status and more. The data is created from household level inputs, using a combination of traditional demographic techniques as well as innovative, propriety processes. A well-rounded set of source files are used in the data development process including many that represent counts at very small levels of geography: the U.S. Census Bureau, the U.S. Bureau of Labor Statistics, the Federal Reserve \begin{tabular}{c|l|c} \hline DENSITY CLASS & DESCRIPTION & HOUSEHOLDS per Sq. MILE \\ \hline 1 & Super Urban & 8,000+ \\ \hline 2 & Urban & 4,0007,999 \\ \hline 3 & Light Urban & 2,0003,999 \\ \hline 4 & First Tier Suburban & 1,0001,999 \\ \hline 5 & Second Tier Suburban & 600999 \\ \hline 6 & Exurban/Small & 100599 \\ \hline 7 & Rural & 099 \\ \hline \end{tabular} Unlike other demographic analysis tools that incorporate a level of detail no finer than block groups or dissemination areas. TargetPro utilizes a methodology for aggregating data to rings, polygons and custom areas that incorporate data from the lowest available centroid level. Any boundary file (Census defined areas, postal codes, carrier routes, telecom files, cable systems, ring studies or user-defined areas) can be studied with confidence that analysis will produce the most accurate figures available. Additional Data Sets CENSUS 1996 The Census data includes information on Canada's population covering the nation's demographic, educational, ethno-cultural, income, language, labor force and mobility characteristics. CENSUS 2001 MapInfo Canada is distributing the 2001 Canadian Census as value added PowerPacks released when made available by Statistics Canada. In total, eight PowerPacks will be released covering all 2001 Census topics. ESTIMATES AND PROJECTIONS (CANADA \& U.S.) Estimates and Projections is the definitive database for the most accurate and up-to-date demographic information on the market from Maplnfo. Engineered as an updated and complimentary version of key Census topics, the quality and accuracy of MapInfo's Estimates and Projections database is unsurpassed in the marketplace. The data is created using a combination of traditional demographic techniques as well as innovative, proprietary processes that result in a very robust and precise database. The Estimates and Projections database presents estimates and projections of population (by age and sex) and households (by age of primary maintainer) for 2002, 2005, 2007 and 2012. The file also includes estimates and projections of aggregate and average household income for current, three and five years, as well as estimates of aggregated and average household expenditure for 2002 . MapInfo Discovery Tw lets analysts share their maps within and between departments Maps are viewed using standard web browsers, such as Microsoft Internet Explorer. No special plug-ins are required. Colleagues, executives and others in your organization can interact with your maps - pan, zoom, use the Info Tool, and turn on and off layers-you're providing more than a static "picture." CHECK OUT MAPINFO DISCOVERY AT WWW.MAPINFO.COM/DISCOVERY Board, Canadian Census and Statistics, the Consumer Price Index, TotalSource from Equifax, USPS Delivery Statistics and more are used to build our estimates and projections. Each U.S. block group or Canadian disemination area (DA) is reviewed on a yearly basis to make certain it is current and reflects the most accurate estimates and behavior available. The following U.S. Demographic PowerPack Modules are available individually or in sets or bundles: AgebyIncomeAgebyRacebySexDetailedAgeDetailedIncomeEducationEthnicPopulationFinancialandWealthAssetsFiveYearAgeFiveYearIncomeFiveYearRaceHispanicDetailHousingCharacteristicsHousingUnitsHousingValuesMarriageandFamilyOccupationandEmploymentRetailSalesPotentialSocio-economicMeasureUpdate Maplnfo PSYTE Neighborhood Classification System The Maplnfo PSYTE system is a superior segmentation model of actual consumer neighborhoods at the U.S. block group or Canadian disemination area level. Used with TargetPro, the PSYTE system has proven exceptionally effective in its ability to segment, discriminate and predict consumer behavior regarding products and services, as well as consumer mass and direct media responses. - PSYTE-UNITED STATES PSYTE segments the U.S. population into 65 clusters based on U.S. household behavioral data such as consumer automotive preferences and demographic data. Each descriptive cluster represents a neighborhood type where the population shares similar demographics, product preferences and spending patterns. PSYTE clusters profile any list database or geographic area and allow users to target others with similar characteristics. - PSYTE-CANADA PSYTE segments the entire Canadian population into 15 Major Lifestyle Groups and 60 mutually exclusive neighborhood types. PSYTE is an innovative tool for analyzing markets, gaining market intelligence and insight and interpreting consumer behavior across the diverse Canadian marketplace. Consumer Potential Detail Module This comprehensive consumer-spending module provides estimates of a geographic area's demand for products and services. These variables include 20 major categories and hundreds of individual items from television sets and coffee to health insurance and power tools. They are an excellent source of information for identifying market potential for your consumer product or service. Consumer Spending Potential (CSP) The Consumer Spending Potential database identifies expenditure patterns of Canadians on hundreds of items ranging from shelter to pet food and appliances to sporting events. Modeled for small areas by MapInfo's methodologists, the CSP database is derived from Statistics Canada's Family Expenditure Survey (FAMEX), MapInfo's Estimates \& Projections and PSYTE cluster system. Lifestyle Data MRI Mediamark Research, Inc. (MRI) provides compiled survey data on consumer lifestyle preferences and expenditures for a variety of popular goods and services within the United States. This survey, conducted continuously since 1979 , covers demographics, product usage and media exposure of 40,000 respondents, with 20,000 new respondents each year. Each module is based on two years worth of survey data. The MRI module is an option for use with TargetPro. The following data sets are available
Step by Step Solution
There are 3 Steps involved in it

Get step-by-step solutions from verified subject matter experts