

Locating the Next Red Lobster Restaurant From its first Red Lobster in 1968, the chain has...
Fantastic news! We've Found the answer you've been seeking!
Question:
Transcribed Image Text:
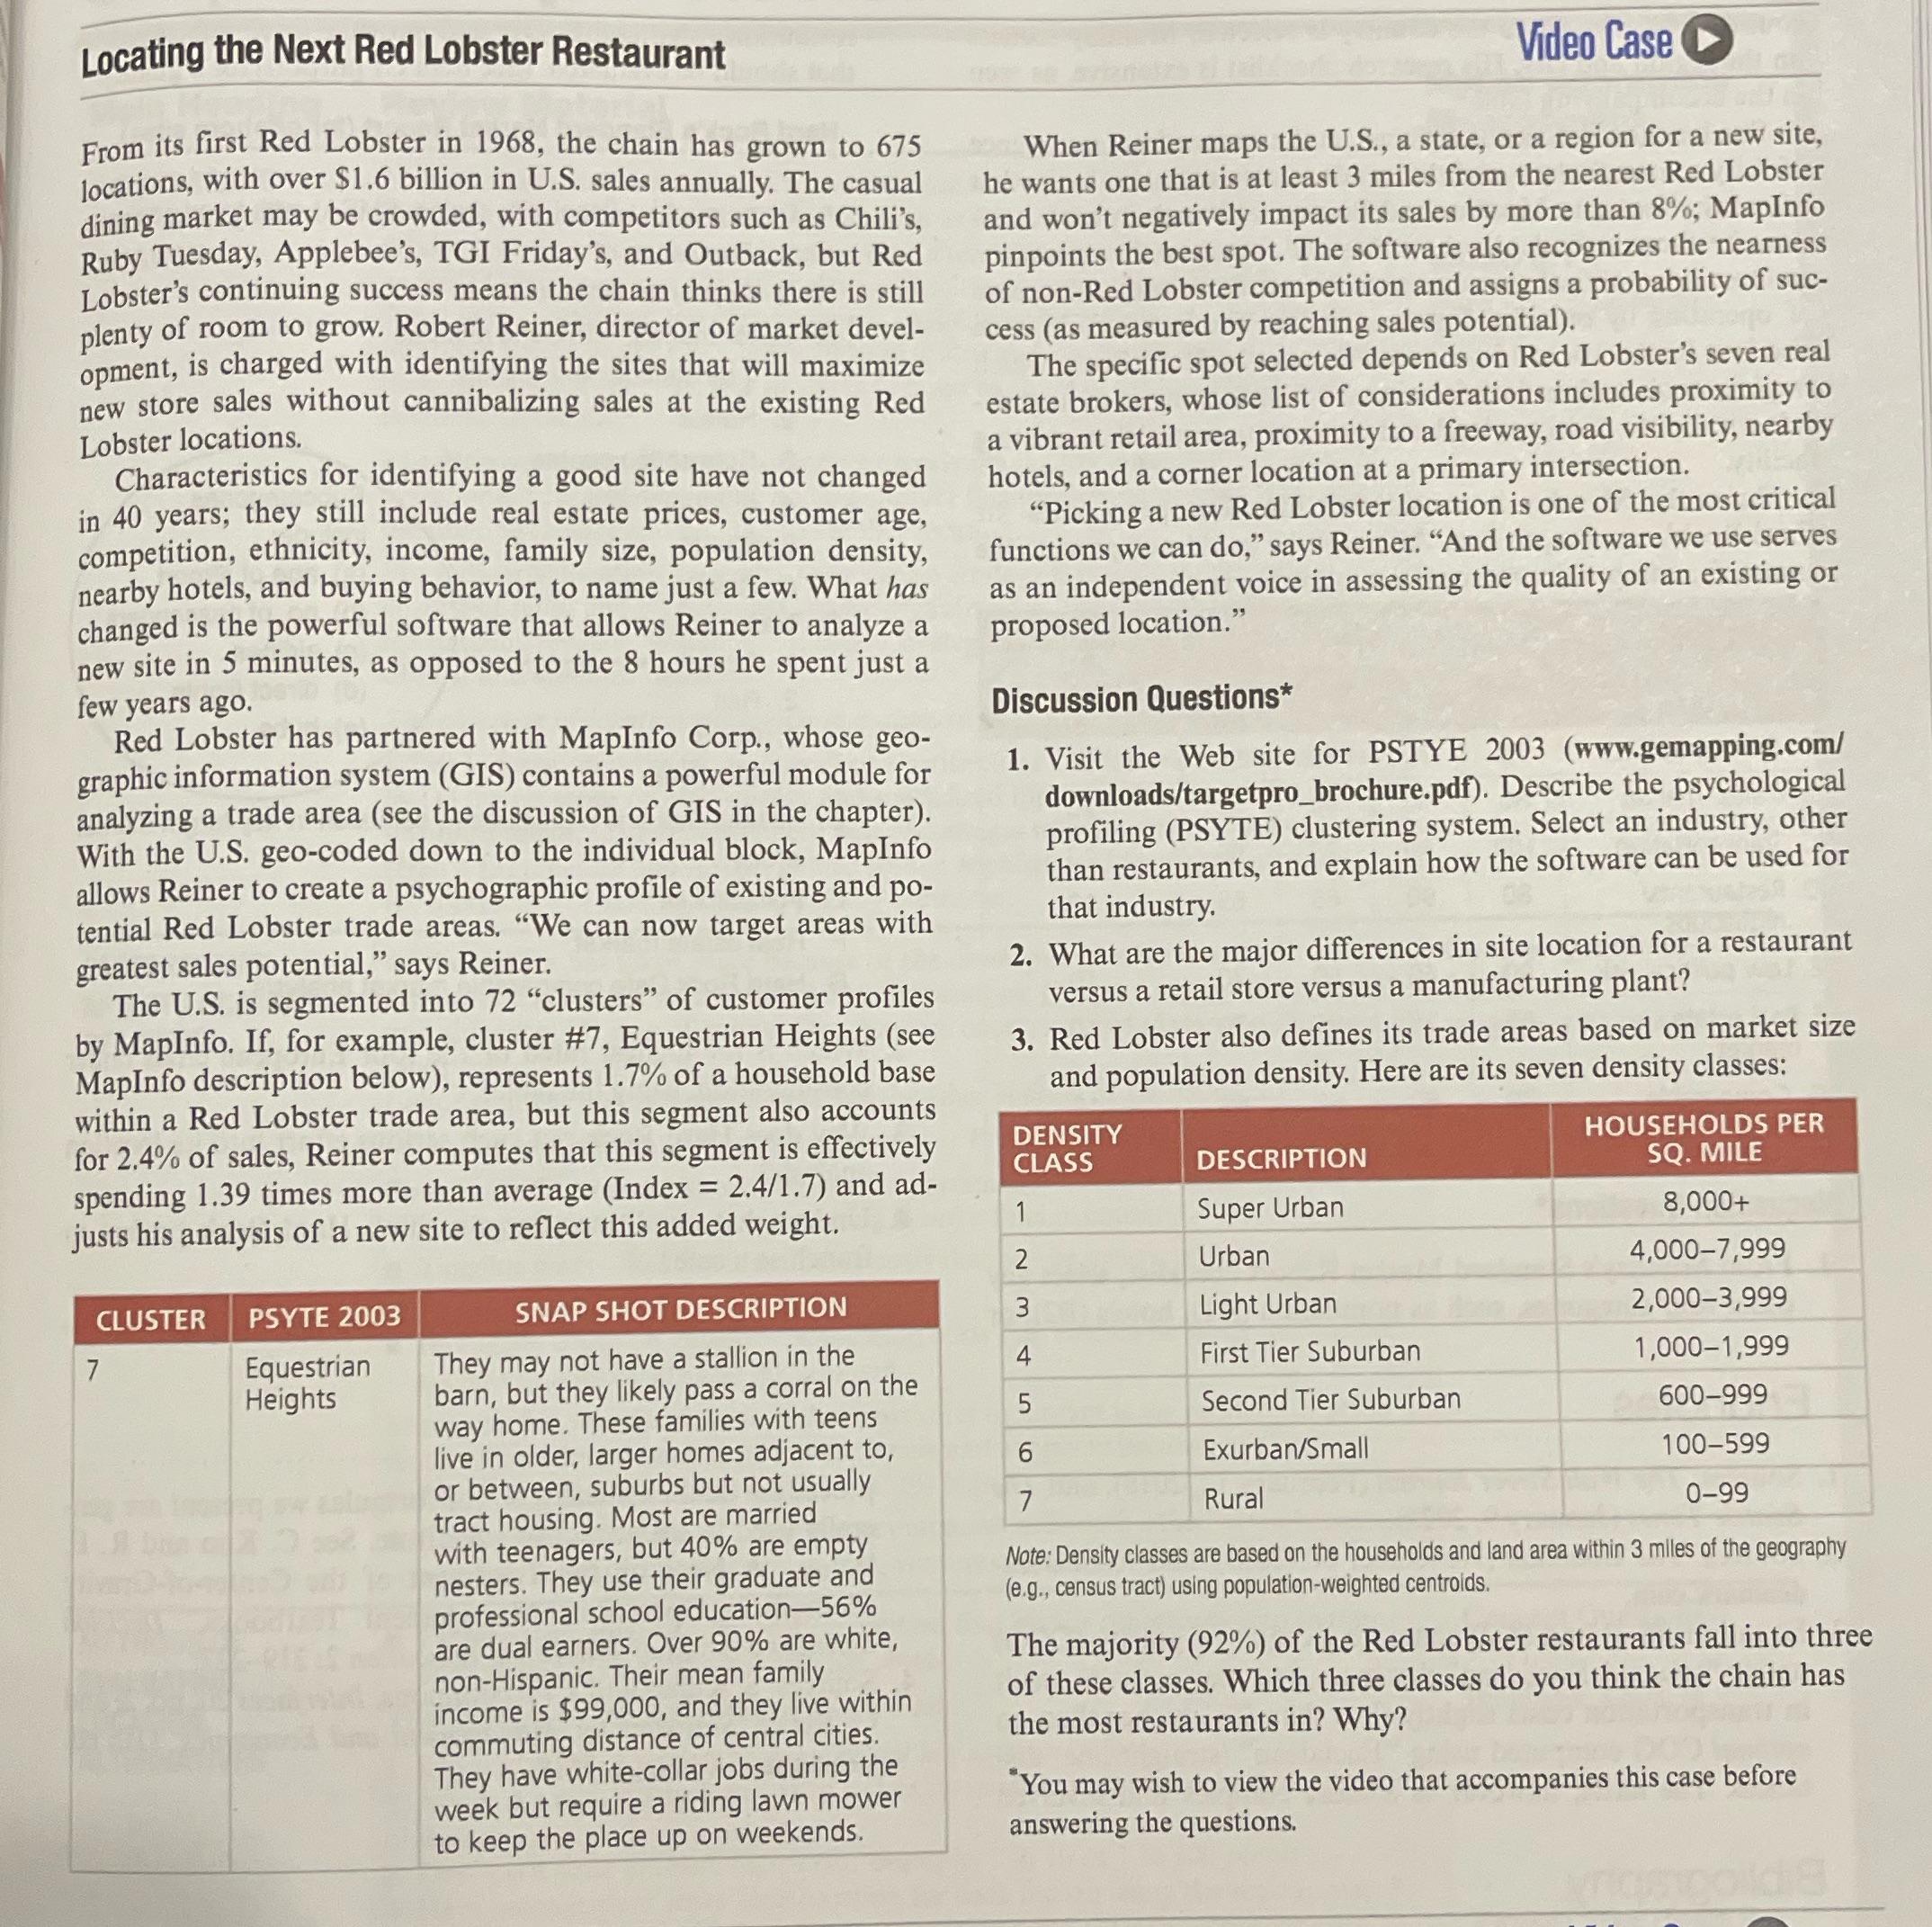
Locating the Next Red Lobster Restaurant From its first Red Lobster in 1968, the chain has grown to 675 locations, with over $1.6 billion in U.S. sales annually. The casual dining market may be crowded, with competitors such as Chili's, Ruby Tuesday, Applebee's, TGI Friday's, and Outback, but Red Lobster's continuing success means the chain thinks there is still plenty of room to grow. Robert Reiner, director of market devel- opment, is charged with identifying the sites that will maximize new store sales without cannibalizing sales at the existing Red Lobster locations. Characteristics for identifying a good site have not changed in 40 years; they still include real estate prices, customer age, competition, ethnicity, income, family size, population density, nearby hotels, and buying behavior, to name just a few. What has changed is the powerful software that allows Reiner to analyze a new site in 5 minutes, as opposed to the 8 hours he spent just a few years ago. Red Lobster has partnered with MapInfo Corp., whose geo- graphic information system (GIS) contains a powerful module for analyzing a trade area (see the discussion of GIS in the chapter). With the U.S. geo-coded down to the individual block, MapInfo allows Reiner to create a psychographic profile of existing and po- tential Red Lobster trade areas. "We can now target areas with greatest sales potential," says Reiner. The U.S. is segmented into 72 "clusters" of customer profiles by MapInfo. If, for example, cluster #7, Equestrian Heights (see MapInfo description below), represents 1.7% of a household base within a Red Lobster trade area, but this segment also accounts for 2.4% of sales, Reiner computes that this segment is effectively spending 1.39 times more than average (Index = 2.4/1.7) and ad- justs his analysis of a new site to reflect this added weight. CLUSTER 7 PSYTE 2003 Equestrian Heights SNAP SHOT DESCRIPTION They may not have a stallion in the barn, but they likely pass a corral on the way home. These families with teens live in older, larger homes adjacent to, or between, suburbs but not usually tract housing. Most are married with teenagers, but 40% are empty nesters. They use their graduate and professional school education-56% are dual earners. Over 90% are white, non-Hispanic. Their mean family income is $99,000, and they live within commuting distance of central cities. They have white-collar jobs during the week but require a riding lawn mower to keep the place up on weekends. Video Case When Reiner maps the U.S., a state, or a region for a new site, he wants one that is at least 3 miles from the nearest Red Lobster and won't negatively impact its sales by more than 8%; MapInfo pinpoints the best spot. The software also recognizes the nearness of non-Red Lobster competition and assigns a probability of suc- cess (as measured by reaching sales potential). The specific spot selected depends on Red Lobster's seven real estate brokers, whose list of considerations includes proximity to a vibrant retail area, proximity to a freeway, road visibility, nearby hotels, and a corner location at a primary intersection. "Picking a new Red Lobster location is one of the most critical functions we can do," says Reiner. "And the software we use serves as an independent voice in assessing the quality of an existing or proposed location." Discussion Questions* 1. Visit the Web site for PSTYE 2003 (www.gemapping.com/ downloads/targetpro_brochure.pdf). Describe the psychological profiling (PSYTE) clustering system. Select an industry, other than restaurants, and explain how the software can be used for that industry. 2. What are the major differences in site location for a restaurant versus a retail store versus a manufacturing plant? 3. Red Lobster also defines its trade areas based on market size and population density. Here are its seven density classes: HOUSEHOLDS PER SQ. MILE 8,000+ 4,000-7,999 DENSITY CLASS DESCRIPTION 1 Super Urban 2 Urban 3 Light Urban 2,000-3,999 4 First Tier Suburban 1,000-1,999 5 Second Tier Suburban 600-999 6 Exurban/Small 100-599 7 Rural 0-99 10 Note: Density classes are based on the households and land area within 3 miles of the geography (e.g., census tract) using population-weighted centroids. The majority (92%) of the Red Lobster restaurants fall into three of these classes. Which three classes do you think the chain has the most restaurants in? Why? "You may wish to view the video that accompanies this case before answering the questions. Locating the Next Red Lobster Restaurant From its first Red Lobster in 1968, the chain has grown to 675 locations, with over $1.6 billion in U.S. sales annually. The casual dining market may be crowded, with competitors such as Chili's, Ruby Tuesday, Applebee's, TGI Friday's, and Outback, but Red Lobster's continuing success means the chain thinks there is still plenty of room to grow. Robert Reiner, director of market devel- opment, is charged with identifying the sites that will maximize new store sales without cannibalizing sales at the existing Red Lobster locations. Characteristics for identifying a good site have not changed in 40 years; they still include real estate prices, customer age, competition, ethnicity, income, family size, population density, nearby hotels, and buying behavior, to name just a few. What has changed is the powerful software that allows Reiner to analyze a new site in 5 minutes, as opposed to the 8 hours he spent just a few years ago. Red Lobster has partnered with MapInfo Corp., whose geo- graphic information system (GIS) contains a powerful module for analyzing a trade area (see the discussion of GIS in the chapter). With the U.S. geo-coded down to the individual block, MapInfo allows Reiner to create a psychographic profile of existing and po- tential Red Lobster trade areas. "We can now target areas with greatest sales potential," says Reiner. The U.S. is segmented into 72 "clusters" of customer profiles by MapInfo. If, for example, cluster #7, Equestrian Heights (see MapInfo description below), represents 1.7% of a household base within a Red Lobster trade area, but this segment also accounts for 2.4% of sales, Reiner computes that this segment is effectively spending 1.39 times more than average (Index = 2.4/1.7) and ad- justs his analysis of a new site to reflect this added weight. CLUSTER 7 PSYTE 2003 Equestrian Heights SNAP SHOT DESCRIPTION They may not have a stallion in the barn, but they likely pass a corral on the way home. These families with teens live in older, larger homes adjacent to, or between, suburbs but not usually tract housing. Most are married with teenagers, but 40% are empty nesters. They use their graduate and professional school education-56% are dual earners. Over 90% are white, non-Hispanic. Their mean family income is $99,000, and they live within commuting distance of central cities. They have white-collar jobs during the week but require a riding lawn mower to keep the place up on weekends. Video Case When Reiner maps the U.S., a state, or a region for a new site, he wants one that is at least 3 miles from the nearest Red Lobster and won't negatively impact its sales by more than 8%; MapInfo pinpoints the best spot. The software also recognizes the nearness of non-Red Lobster competition and assigns a probability of suc- cess (as measured by reaching sales potential). The specific spot selected depends on Red Lobster's seven real estate brokers, whose list of considerations includes proximity to a vibrant retail area, proximity to a freeway, road visibility, nearby hotels, and a corner location at a primary intersection. "Picking a new Red Lobster location is one of the most critical functions we can do," says Reiner. "And the software we use serves as an independent voice in assessing the quality of an existing or proposed location." Discussion Questions* 1. Visit the Web site for PSTYE 2003 (www.gemapping.com/ downloads/targetpro_brochure.pdf). Describe the psychological profiling (PSYTE) clustering system. Select an industry, other than restaurants, and explain how the software can be used for that industry. 2. What are the major differences in site location for a restaurant versus a retail store versus a manufacturing plant? 3. Red Lobster also defines its trade areas based on market size and population density. Here are its seven density classes: HOUSEHOLDS PER SQ. MILE 8,000+ 4,000-7,999 DENSITY CLASS DESCRIPTION 1 Super Urban 2 Urban 3 Light Urban 2,000-3,999 4 First Tier Suburban 1,000-1,999 5 Second Tier Suburban 600-999 6 Exurban/Small 100-599 7 Rural 0-99 10 Note: Density classes are based on the households and land area within 3 miles of the geography (e.g., census tract) using population-weighted centroids. The majority (92%) of the Red Lobster restaurants fall into three of these classes. Which three classes do you think the chain has the most restaurants in? Why? "You may wish to view the video that accompanies this case before answering the questions.
Expert Answer:

Related Book For 

Operations Management Sustainability And Supply Chain Management
ISBN: 9780137476442
14th Edition
Authors: Jay Heizer, Barry Render, Chuck Munson
Posted Date:
Students also viewed these general management questions
-
From its first Red Lobster in 1968, the chain has grown to 675 locations, with over $1.6 billion in U.S. sales annually. The casual dining market may be crowded, with competitors such as Chilis, Ruby...
-
From its first Red Lobster in 1968, Darden Restaurants has grown the chain to 690 locations, with over $2.6 billion in U.S sales annually. The casual dinning market may be crowded, with competitors...
-
Income Statement Accounts December 31, 20X1 Sales Sales Returns and Allowances Purchases Purchase Returns and Allowance Advertising Sales Salaries Commission Expense Miscellaneous Selling Expense...
-
In our discussion of the KPMG professional judgment framework, we pointed out that biased judgments can be made because of judgment tendencies. One such tendency that was not included in the...
-
Using the data from E-S-15, make the adjusting entries that Glimmer Pools would need to make on December 31, 2018, related to the investment in AKL bonds. How would the bonds be reported on Glimmer...
-
When the Concepcions went to AT&T to get a phone, they were confused as to why they were paying money for the phone when it was advertised as being free. They had to pay sales tax on the full normal...
-
Condensed financial data of Sinjh Inc. follow. Additional information: 1. New plant assets costing $80,000 were purchased for cash during the year. 2. Old plant assets having an original cost of...
-
List the four main data definition language keywords and explain them with examples?
-
A long straight horizontal wire carries a current I = 3.50 A to the left. A positive 1.00 C charge moves to the right at a distance 3.50 m above the wire at constant speed v = 5000 m/s What are the...
-
Once vendors are hired, procurement and project managers actively track vendor performances and maintain positive vendor relationships. Based on performances, vendors may either be awarded another...
-
The value of delta E for a system that performs 111 kJ of work on its surroundings and gains 89 kJ of heat is ______ kJ. -111 200 22 O-22 -200
-
d. [6] Assume that a file "test.file" exists and the file has only one word "Hello" in its first line. What is the message do you seen after running the following C program: #include #include...
-
What are the two potential risk factor and appropriate strategies for service delivery in any situation. Explain Briefly
-
Consider the 2017 Financial Statements of 305 Memorial Hospital, which are provided in the appendix. The following transactions (k represents thousands of dollars) occurred in January 2018. a. The...
-
Harold, Kumar and Neil are caught breaking into a waffle factory. The three suspects are interviewed separately and are asked to confess who planned the robbery. Suppose each person has a 40% chance...
-
In Problems 718, write the augmented matrix of the given system of equations. f0.01x0.03y = 0.06 [0.13x + 0.10y = 0.20
-
Distinguish between effective capacity and actual output.
-
Arethas Bicycle Company (ABC) has the hottest new product on the upscale toy marketboys and girls bikes in bright fashion colors, with oversize hubs and axles; shell design safety tires; strong...
-
Refer to Problem 8.1. Shipping cost from Myanmar to Denver, Colorado, the final destination, is $3.00 per unit. Shipping cost from China to Denver is $2.00 per unit, while the shipping cost from...
-
What might be problematic about these responses to interview questions? How might the answers be improved? a. Q: Tell me about yourself. A: Im really easy-going and casual. b. Q: I noticed that you...
-
Revise the follow-up message below to be more professional and effective, based on the principles in this chapter. December 2, 2021 Ms. Charlotte LeClaire Pebble Creek Publishing Inc. New York, NY...
-
Write a follow-up email message or letter after an office visit or plant trip. Thank your hosts for their hospitality; relate your strong points to things you learned about the company during the...

Study smarter with the SolutionInn App