

Question: Income Statement Cash Flow Statement Balance Sheet All figures in USD thousands 2023F 2024F 2025F All figures in USD thousands 2023F 2024F 2025F All figures
| Income Statement | Cash Flow Statement | Balance Sheet | ||||||||||||||||||
| All figures in USD thousands | 2023F | 2024F | 2025F | All figures in USD thousands | 2023F | 2024F | 2025F | All figures in USD thousands | 2022A | 2023F | 2024F | 2025F | ||||||||
| CASH FROM OPERATIONS | ASSETS | |||||||||||||||||||
| Revenue | 58,150 | 65,570 | 73,230 | Net Income | Cash | 5,000 | 13,100 | 6,520 | 4,260 | |||||||||||
| COGS | (45,540) | (47,230) | (49,250) | Depreciation | Accounts Receivable | 6,000 | 5,150 | 4,100 | 3,000 | |||||||||||
| Gross Profit | 12,610 | 18,340 | 23,980 | Deferred Tax | Inventory | 2,000 | 3,200 | 4,000 | 5,000 | |||||||||||
| Cash from Accounts Receivable | Property Plant & Equipment | 65,000 | 66,000 | 67,500 | 69,500 | |||||||||||||||
| Cash from Inventory | Total Assets | 78,000 | 87,450 | 82,120 | 81,760 | |||||||||||||||
| SG&A | (6,120) | (7,310) | (8,250) | Cash from Accounts Payable | ||||||||||||||||
| Other | (1,940) | (2,150) | (2,250) | Subtotal | 850 | |||||||||||||||
| EBITDA | 4,550 | 8,880 | 13,480 | |||||||||||||||||
| LIABILITIES | ||||||||||||||||||||
| CASH FROM INVESTING | Accounts Payable | 3,000 | 3,950 | 5,000 | 5,950 | |||||||||||||||
| Depreciation | (4,120) | (4,150) | (4,190) | Capital Expenditure | Line of Credit | 5,000 | 4,000 | 2,000 | 1,000 | |||||||||||
| EBIT | 430 | 4,730 | 9,290 | Subtotal | Term Loan | 20,000 | 17,000 | 14,000 | 11,000 | |||||||||||
| Deferred Taxes | 1,000 | 1,000 | 1,000 | 1,800 | ||||||||||||||||
| Total Liabilities | 29,000 | 25,950 | 22,000 | 19,750 | ||||||||||||||||
| Interest Expense | (5,930) | (6,110) | (6,180) | CASH FROM FINANCING | ||||||||||||||||
| EBT | (5,500) | (1,380) | 3,110 | Line of Credit Issue / (Repay) | ||||||||||||||||
| Term Loan Issue / (Repay) | ||||||||||||||||||||
| Equity Issue / (Buyback) | EQUITY | |||||||||||||||||||
| Current Tax | (120) | Payment of Dividends | Equity Capital | 34,000 | 52,000 | 52,000 | 52,000 | |||||||||||||
| Deferred Tax | Subtotal | Retained Earnings | 15,000 | 9,500 | 8,120 | 10,010 | ||||||||||||||
| Total Tax | 2,990 | Shareholders' Equity | 49,000 | 61,500 | 60,120 | 62,010 | ||||||||||||||
| CASH BALANCE | Total Liabilities & Equity | 78,000 | 87,450 | 82,120 | 81,760 | |||||||||||||||
| Net Income | (5,500) | (1,380) | 2,990 | Beginning | ||||||||||||||||
| Change in Cash | ||||||||||||||||||||
| Ending | Check | |||||||||||||||||||
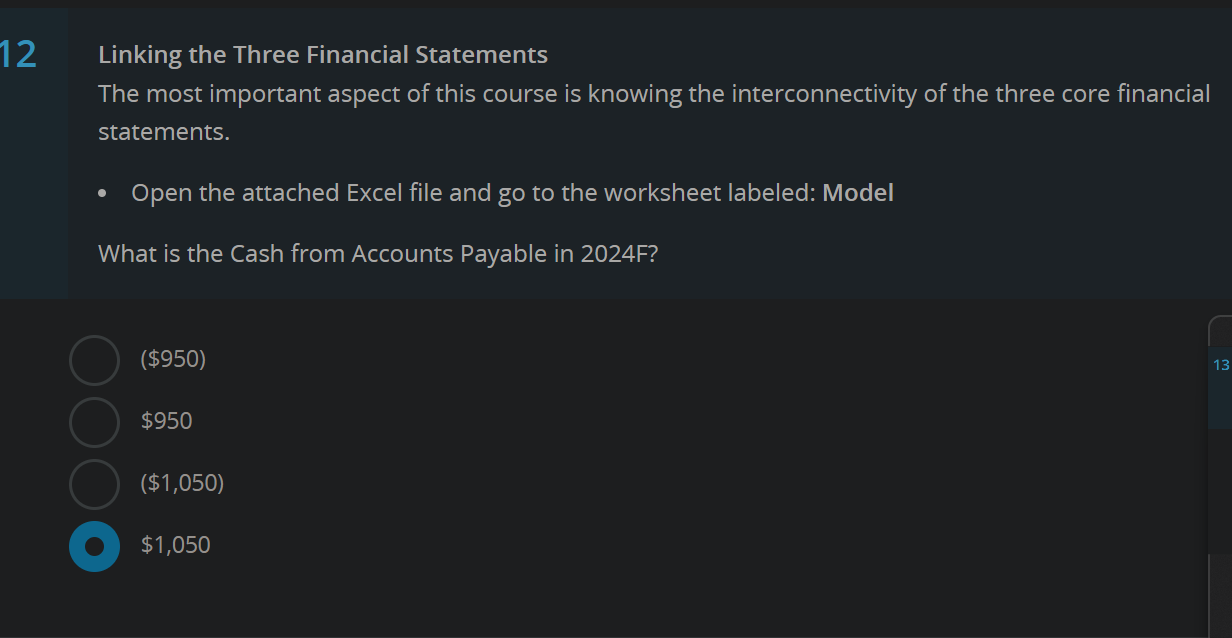
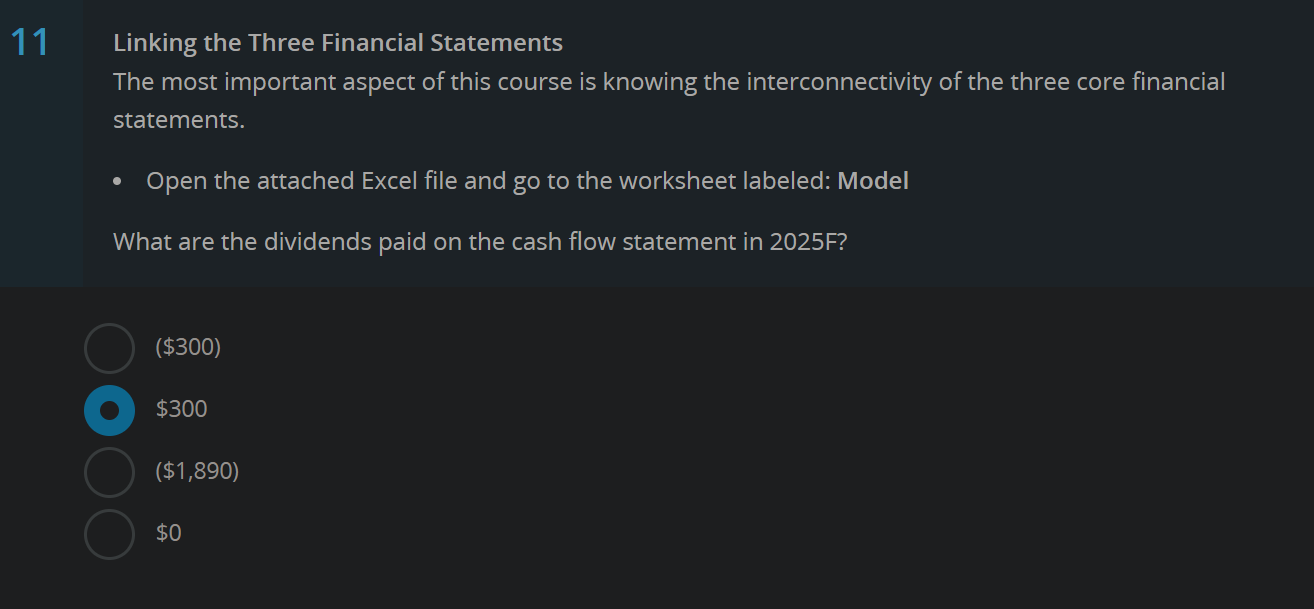
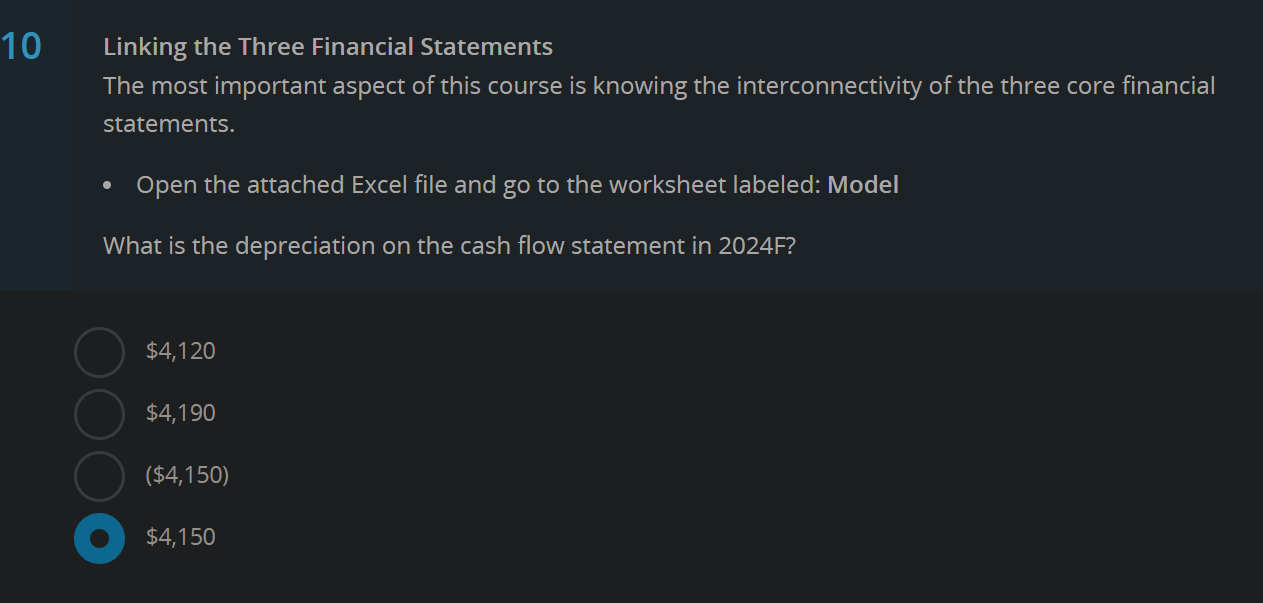
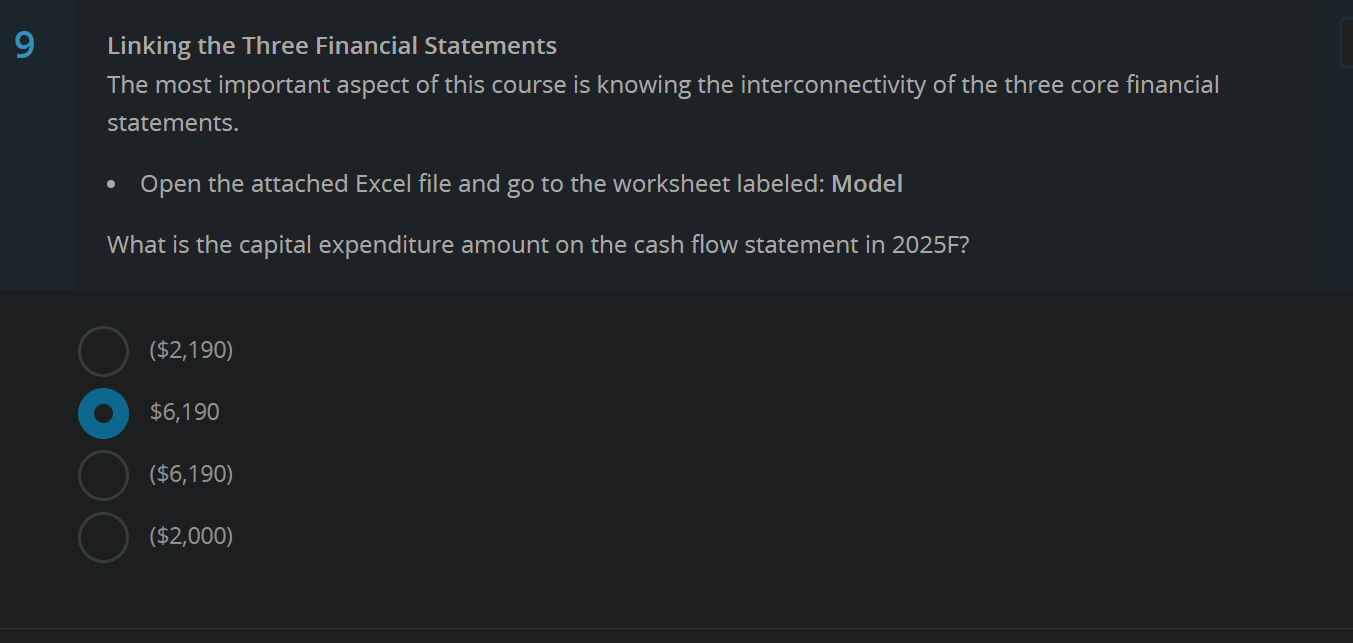
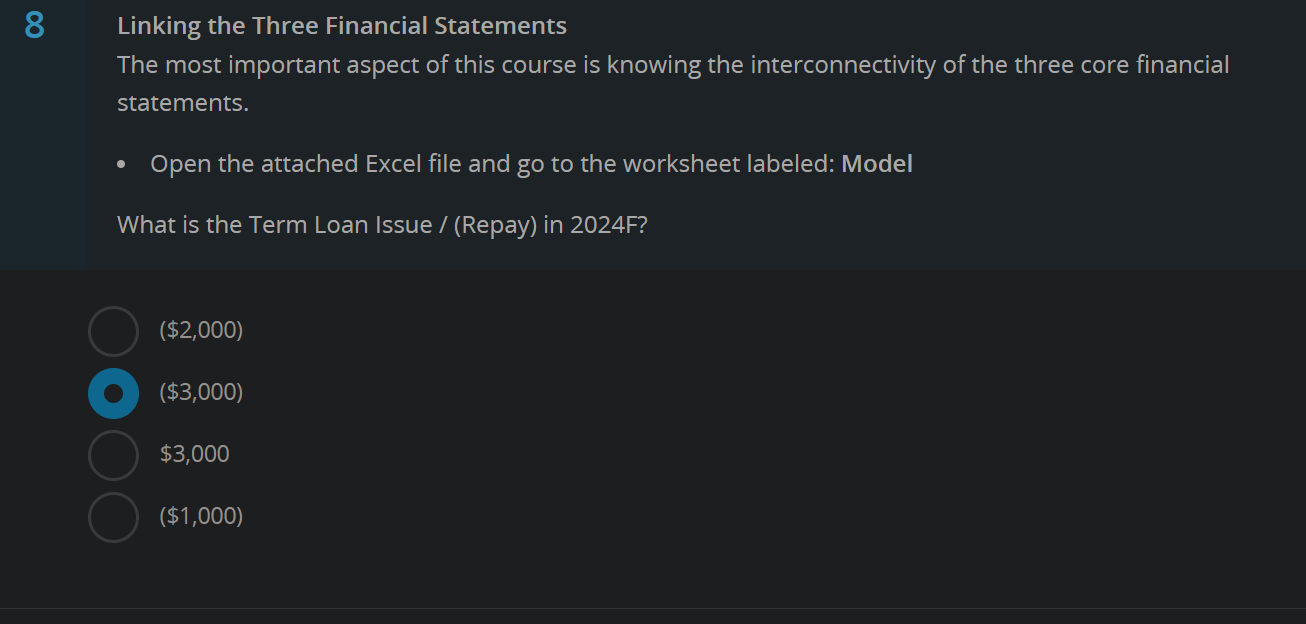
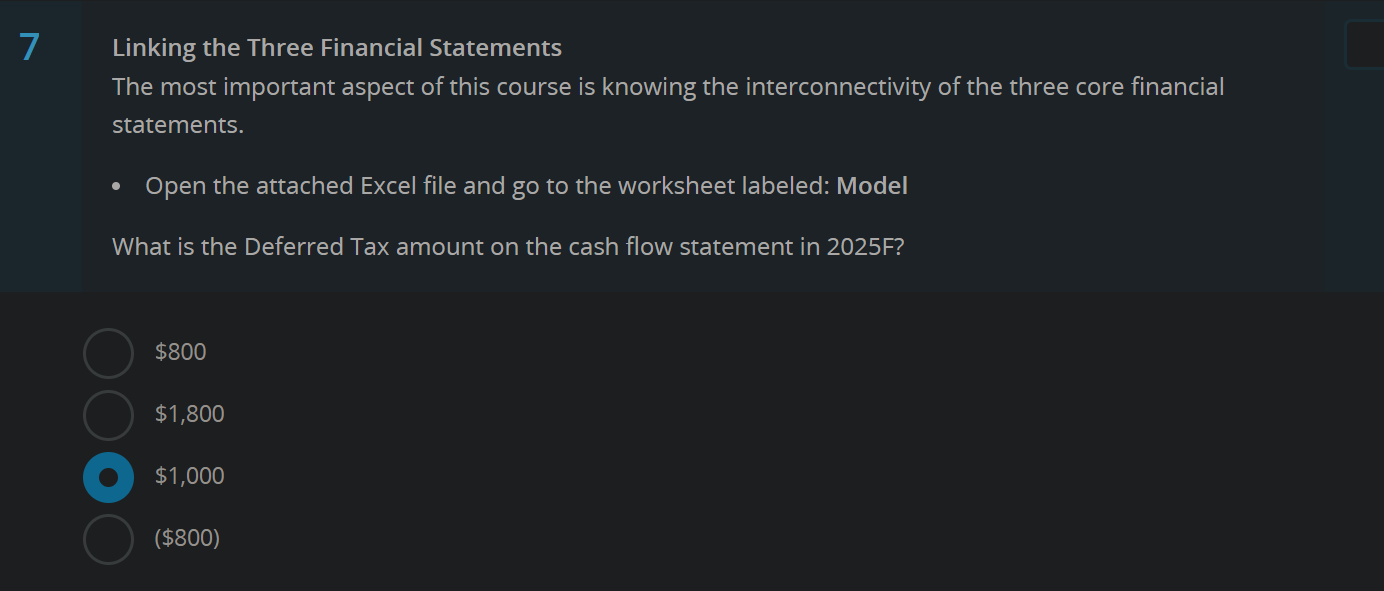
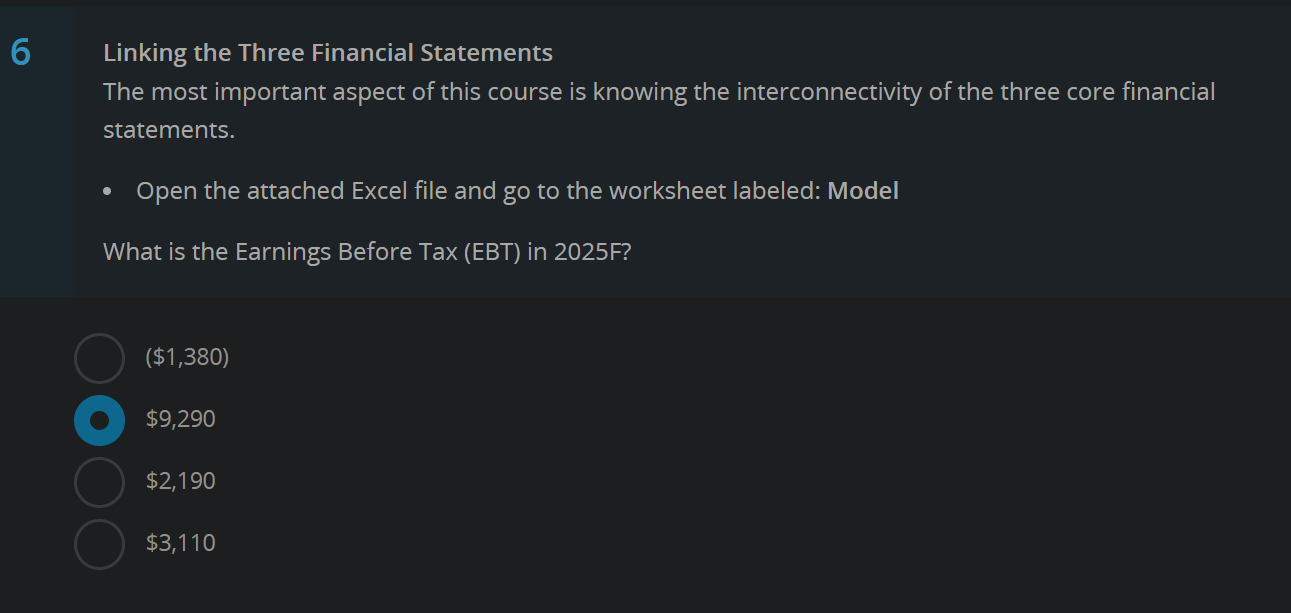
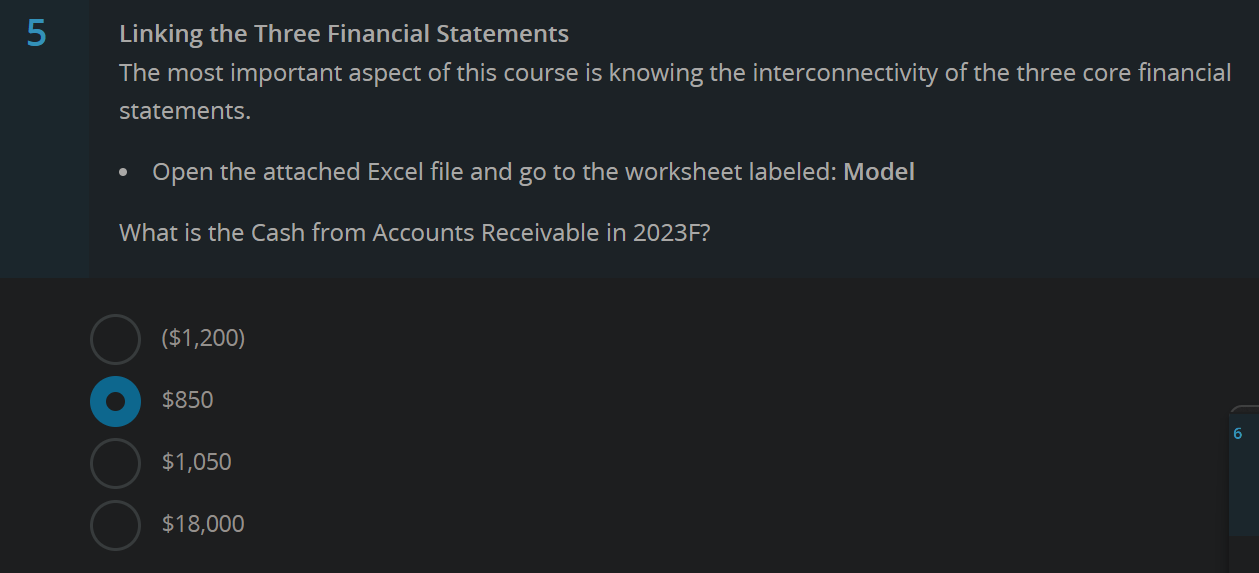
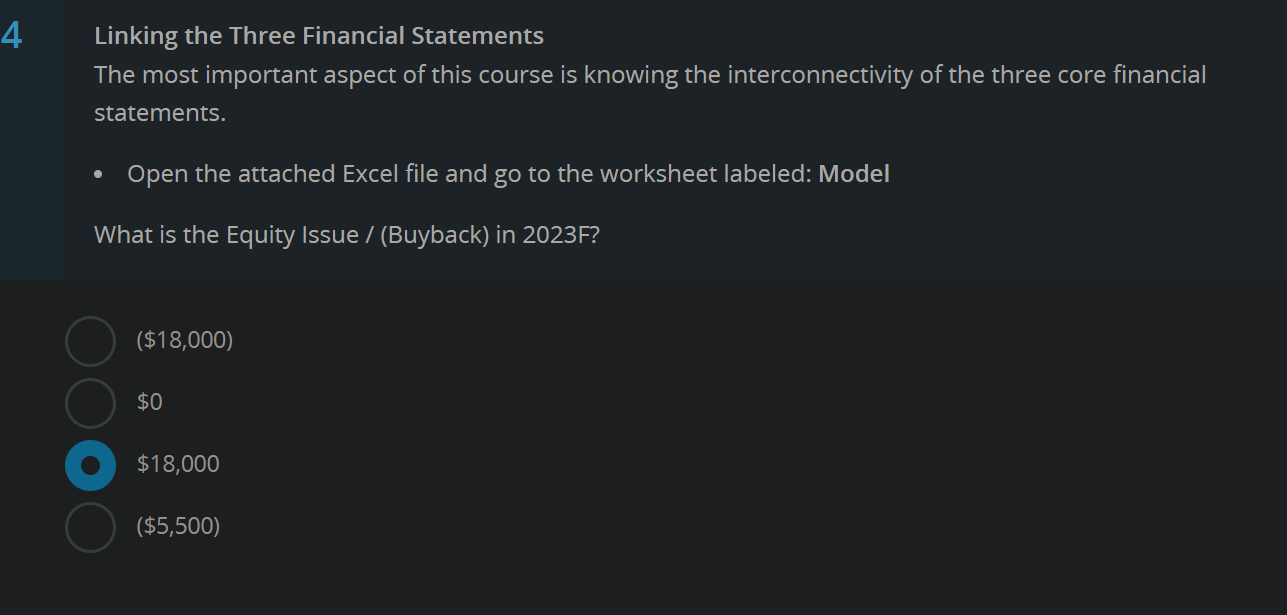
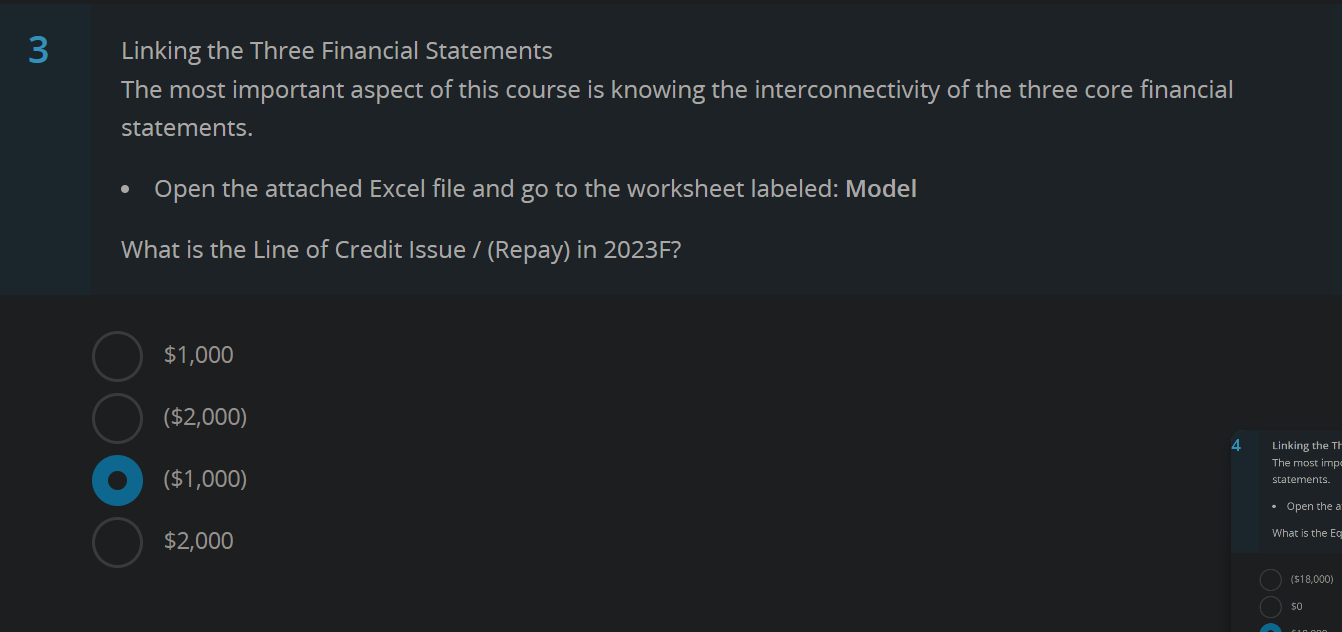
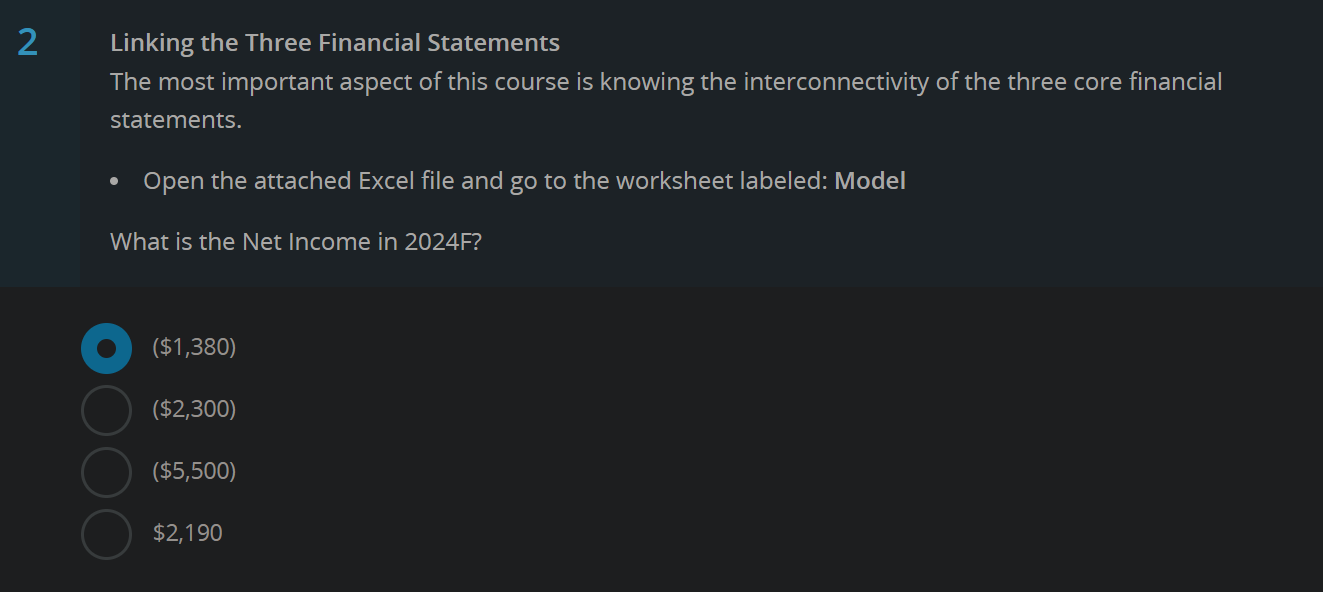
Linking the Three Financial Statements The most important aspect of this course is knowing the interconnectivity of the three core financial statements. - Open the attached Excel file and go to the worksheet labeled: Model What is the Cash from Accounts Payable in 2024F? (\$950) $950 ($1,050) $1,050 Linking the Three Financial Statements The most important aspect of this course is knowing the interconnectivity of the three core financial statements. - Open the attached Excel file and go to the worksheet labeled: Model What is the Line of Credit Issue / (Repay) in 2023F? $1,000 ($2,000) ($1,000) $2,000 Linking the Three Financial Statements The most important aspect of this course is knowing the interconnectivity of the three core financial statements. - Open the attached Excel file and go to the worksheet labeled: Model What is the Cash from Accounts Receivable in 2023F? ($1,200) $850 $1,050 $18,000 Linking the Three Financial Statements The most important aspect of this course is knowing the interconnectivity of the three core financial statements. - Open the attached Excel file and go to the worksheet labeled: Model What is the Term Loan Issue / (Repay) in 2024F? ($2,000) ($3,000) $3,000 ($1,000) Linking the Three Financial Statements The most important aspect of this course is knowing the interconnectivity of the three core financial statements. - Open the attached Excel file and go to the worksheet labeled: Model What are the dividends paid on the cash flow statement in 2025F? (\$300) $300 ($1,890) $0 Linking the Three Financial Statements The most important aspect of this course is knowing the interconnectivity of the three core financial statements. - Open the attached Excel file and go to the worksheet labeled: Model What is the capital expenditure amount on the cash flow statement in 2025F? ($2,190) $6,190 ($6,190) ($2,000) Linking the Three Financial Statements The most important aspect of this course is knowing the interconnectivity of the three core financial statements. - Open the attached Excel file and go to the worksheet labeled: Model What is the Earnings Before Tax (EBT) in 2025F? ($1,380) $9,290 $2,190 $3,110 Linking the Three Financial Statements The most important aspect of this course is knowing the interconnectivity of the three core financial statements. - Open the attached Excel file and go to the worksheet labeled: Model What is the Net Income in 2024F? ($1,380) ($2,300) ($5,500) $2,190 Linking the Three Financial Statements The most important aspect of this course is knowing the interconnectivity of the three core financial statements. - Open the attached Excel file and go to the worksheet labeled: Model What is the Deferred Tax amount on the cash flow statement in 2025F? $800 $1,800 $1,000 Linking the Three Financial Statements The most important aspect of this course is knowing the interconnectivity of the three core financial statements. - Open the attached Excel file and go to the worksheet labeled: Model What is the Equity Issue / (Buyback) in 2023F? ($18,000) $0 $18,000 ($5,500) Linking the Three Financial Statements The most important aspect of this course is knowing the interconnectivity of the three core financial statements. - Open the attached Excel file and go to the worksheet labeled: Model What is the depreciation on the cash flow statement in 2024F? $4,120 $4,190 ($4,150) $4,150 Linking the Three Financial Statements The most important aspect of this course is knowing the interconnectivity of the three core financial statements. - Open the attached Excel file and go to the worksheet labeled: Model What is the Cash from Accounts Payable in 2024F? (\$950) $950 ($1,050) $1,050 Linking the Three Financial Statements The most important aspect of this course is knowing the interconnectivity of the three core financial statements. - Open the attached Excel file and go to the worksheet labeled: Model What is the Line of Credit Issue / (Repay) in 2023F? $1,000 ($2,000) ($1,000) $2,000 Linking the Three Financial Statements The most important aspect of this course is knowing the interconnectivity of the three core financial statements. - Open the attached Excel file and go to the worksheet labeled: Model What is the Cash from Accounts Receivable in 2023F? ($1,200) $850 $1,050 $18,000 Linking the Three Financial Statements The most important aspect of this course is knowing the interconnectivity of the three core financial statements. - Open the attached Excel file and go to the worksheet labeled: Model What is the Term Loan Issue / (Repay) in 2024F? ($2,000) ($3,000) $3,000 ($1,000) Linking the Three Financial Statements The most important aspect of this course is knowing the interconnectivity of the three core financial statements. - Open the attached Excel file and go to the worksheet labeled: Model What are the dividends paid on the cash flow statement in 2025F? (\$300) $300 ($1,890) $0 Linking the Three Financial Statements The most important aspect of this course is knowing the interconnectivity of the three core financial statements. - Open the attached Excel file and go to the worksheet labeled: Model What is the capital expenditure amount on the cash flow statement in 2025F? ($2,190) $6,190 ($6,190) ($2,000) Linking the Three Financial Statements The most important aspect of this course is knowing the interconnectivity of the three core financial statements. - Open the attached Excel file and go to the worksheet labeled: Model What is the Earnings Before Tax (EBT) in 2025F? ($1,380) $9,290 $2,190 $3,110 Linking the Three Financial Statements The most important aspect of this course is knowing the interconnectivity of the three core financial statements. - Open the attached Excel file and go to the worksheet labeled: Model What is the Net Income in 2024F? ($1,380) ($2,300) ($5,500) $2,190 Linking the Three Financial Statements The most important aspect of this course is knowing the interconnectivity of the three core financial statements. - Open the attached Excel file and go to the worksheet labeled: Model What is the Deferred Tax amount on the cash flow statement in 2025F? $800 $1,800 $1,000 Linking the Three Financial Statements The most important aspect of this course is knowing the interconnectivity of the three core financial statements. - Open the attached Excel file and go to the worksheet labeled: Model What is the Equity Issue / (Buyback) in 2023F? ($18,000) $0 $18,000 ($5,500) Linking the Three Financial Statements The most important aspect of this course is knowing the interconnectivity of the three core financial statements. - Open the attached Excel file and go to the worksheet labeled: Model What is the depreciation on the cash flow statement in 2024F? $4,120 $4,190 ($4,150) $4,150
Step by Step Solution
There are 3 Steps involved in it

Get step-by-step solutions from verified subject matter experts