

Question: Question: Dashboard: Charts & Graphs All Figures In USD Thousands Uniess Stoted Driver Swritch INCOME STATEMENT Revenue EBITDA EBITDA Margin Net Income Net Income Margin
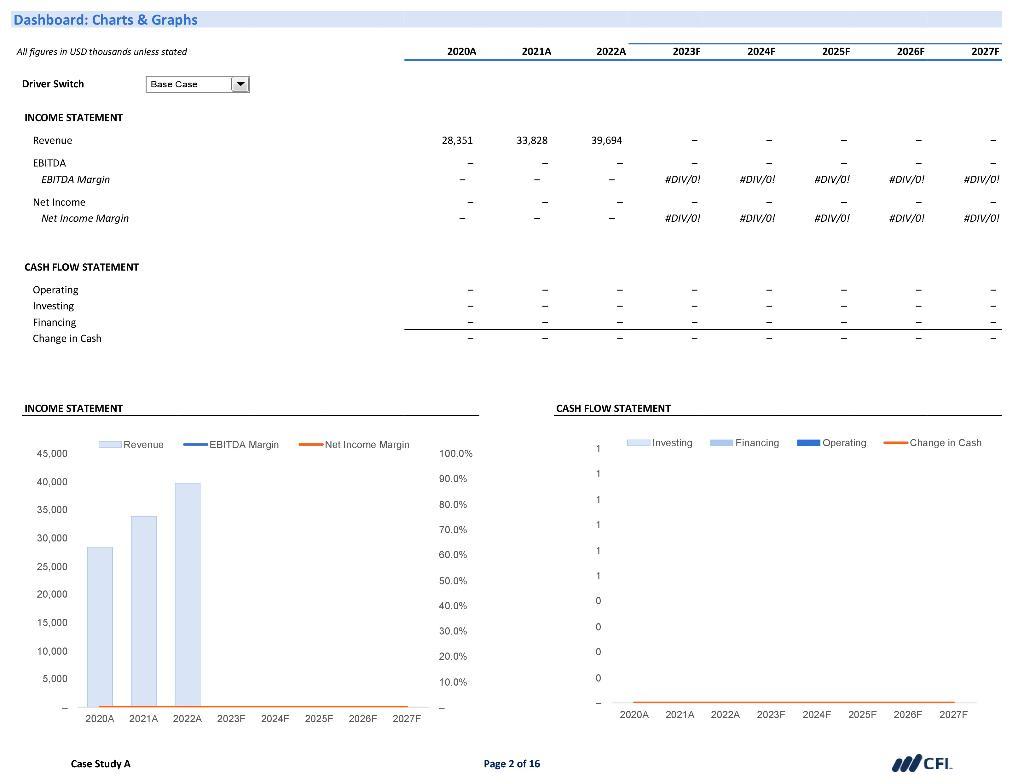
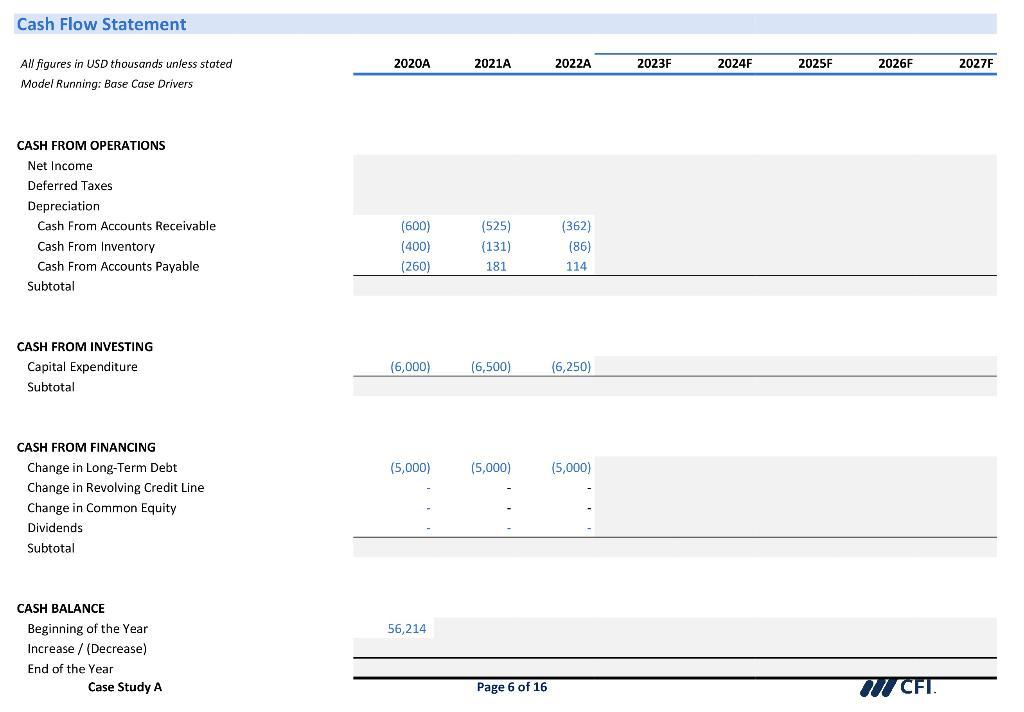
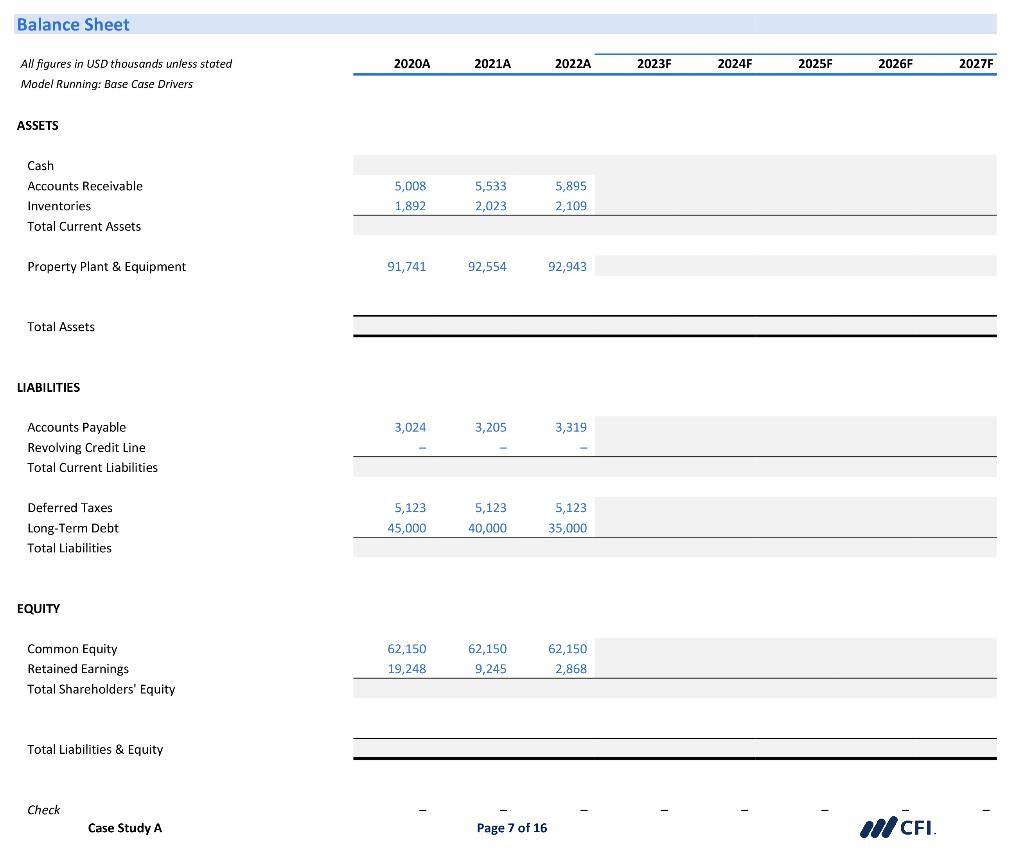
Question: Dashboard: Charts & Graphs All Figures In USD Thousands Uniess Stoted Driver Swritch INCOME STATEMENT Revenue EBITDA EBITDA Margin Net Income Net Income Margin CASH FLOW STATEMENT Operating Investing Financing Change In Cash CASH FLOW STATEMENT INCOME STATEMENT Begin{Tabular}{Ccccccccc} − & − & − & − & − & − & − & − − & − & − & − & − & − & − & − − &
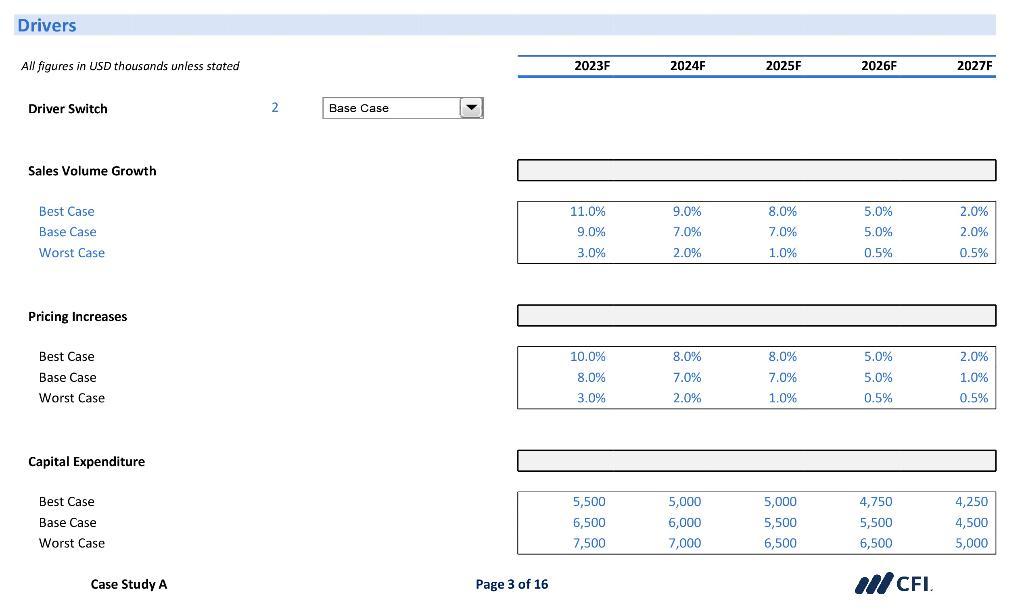
1) What is the EBIT in 2023 when running the Best Case Drivers?
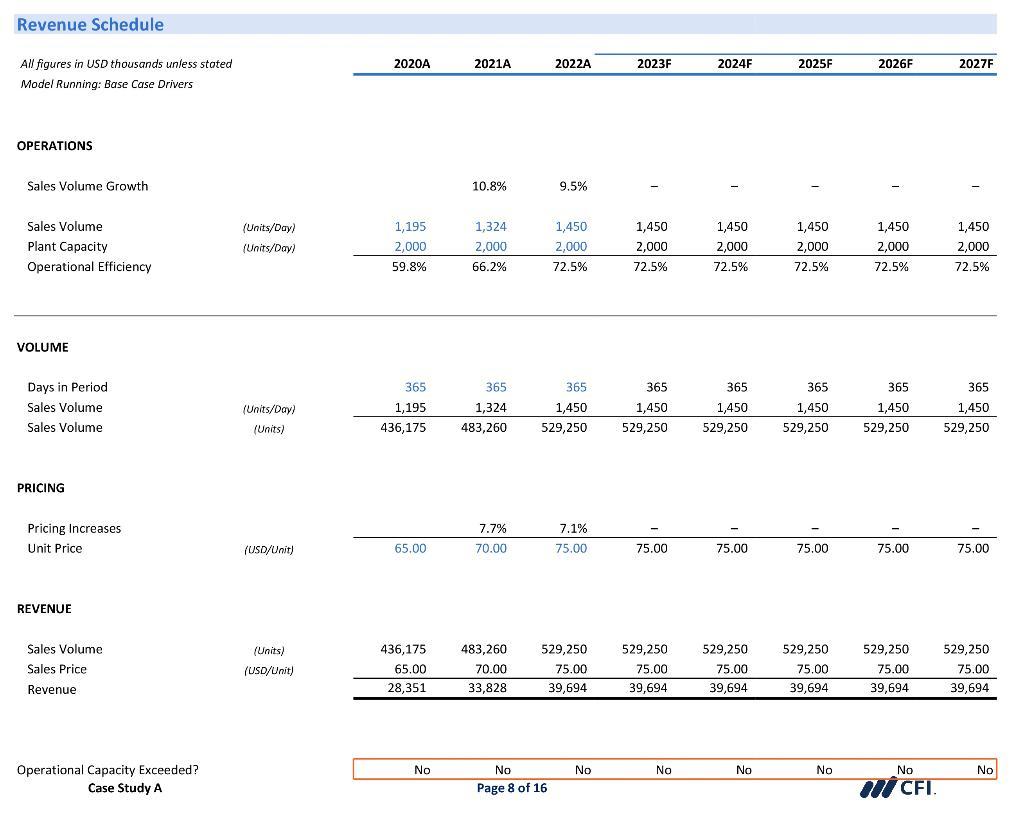
2) What is the Revenue in 2025 when running the Base Case Drivers?
3)What is the Equity Value Per Share when running the Base Case Drivers (Perpetuity Method)?
Dashboard: Charts & Graphs All figures in USD thousands unless stated Driver Switch INCOME STATEMENT Revenue EBITDA EBITDA Margin Net Income Net Income Margin CASH FLOW STATEMENT Operating Investing Financing Change in Casht INCOME STATEMENT 45,000 40.000 35,000 30,000 25,000 20,000 15,000 10,000 5,000 2020A Base Case Revenue 2021A Case Study A EBITDA Margin -Net Income Margin 2022A 2023F 2024F 2025F 2026F 2027F 2020A 28,351 100.0% 90.0% 80.0% 70.0% 60.0% 50.0% 40.0% 30,0% 20.0% 10.0% 2021A 33,828 Page 2 of 16 2022A 39,694 1 CASH FLOW STATEMENT 1 1 1 1 0 0 0 0 2023F #DIV/0! #DIV/0! Investing 2024F #DIV/0! #DIV/0! Financing 2020A 2021A 2022A 2023F 2025F #DIV/0! #DIV/0! 2024F 2026F 2025F #DIV/0! #DIV/0! Operating -Change in Cash. 2027F #DIV/0! WCFI #DIV/0! 2026F 2027F
Step by Step Solution
3.33 Rating (156 Votes )
There are 3 Steps involved in it
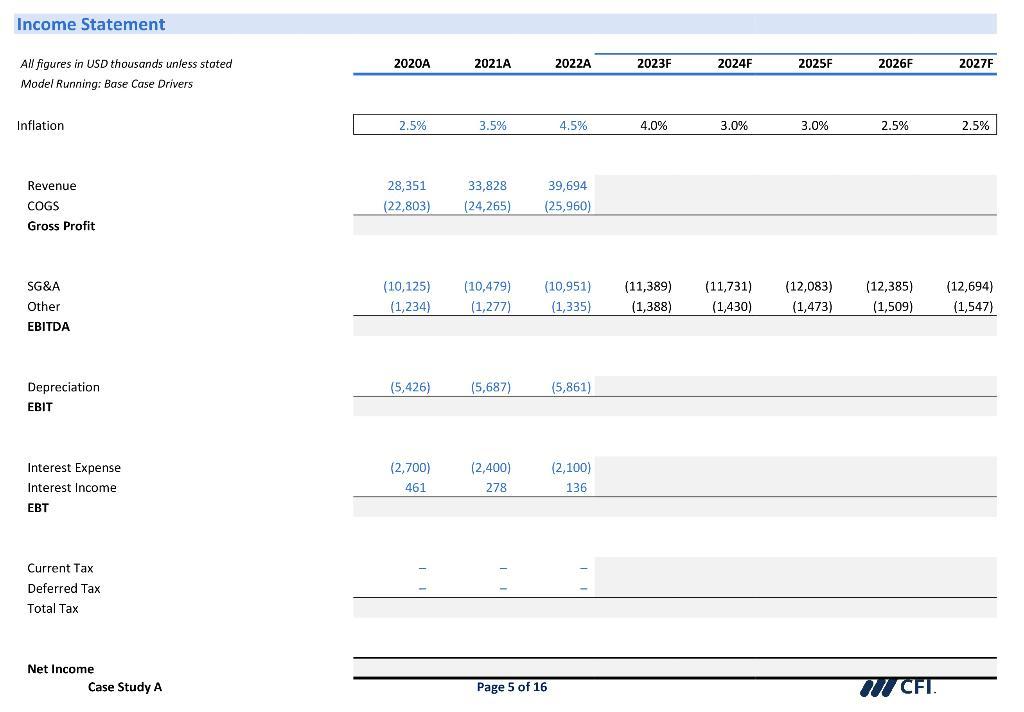
Question 1 What is the EBIT in 2023 when running the Best Case Drivers Calculation EBITDA Margin 85 Revenue USD 1000000 EBIT Revenue EBITDA Margin EBI... View full answer

Get step-by-step solutions from verified subject matter experts