

Question: INCOME STATEMENT - Data Visualization File ( kieso _ ch 0 3 _ AIA _ Tableau _ visualization.twbx ) You are a data analyst at
INCOME STATEMENT Data Visualization File kiesochAIATableauvisualization.twbx
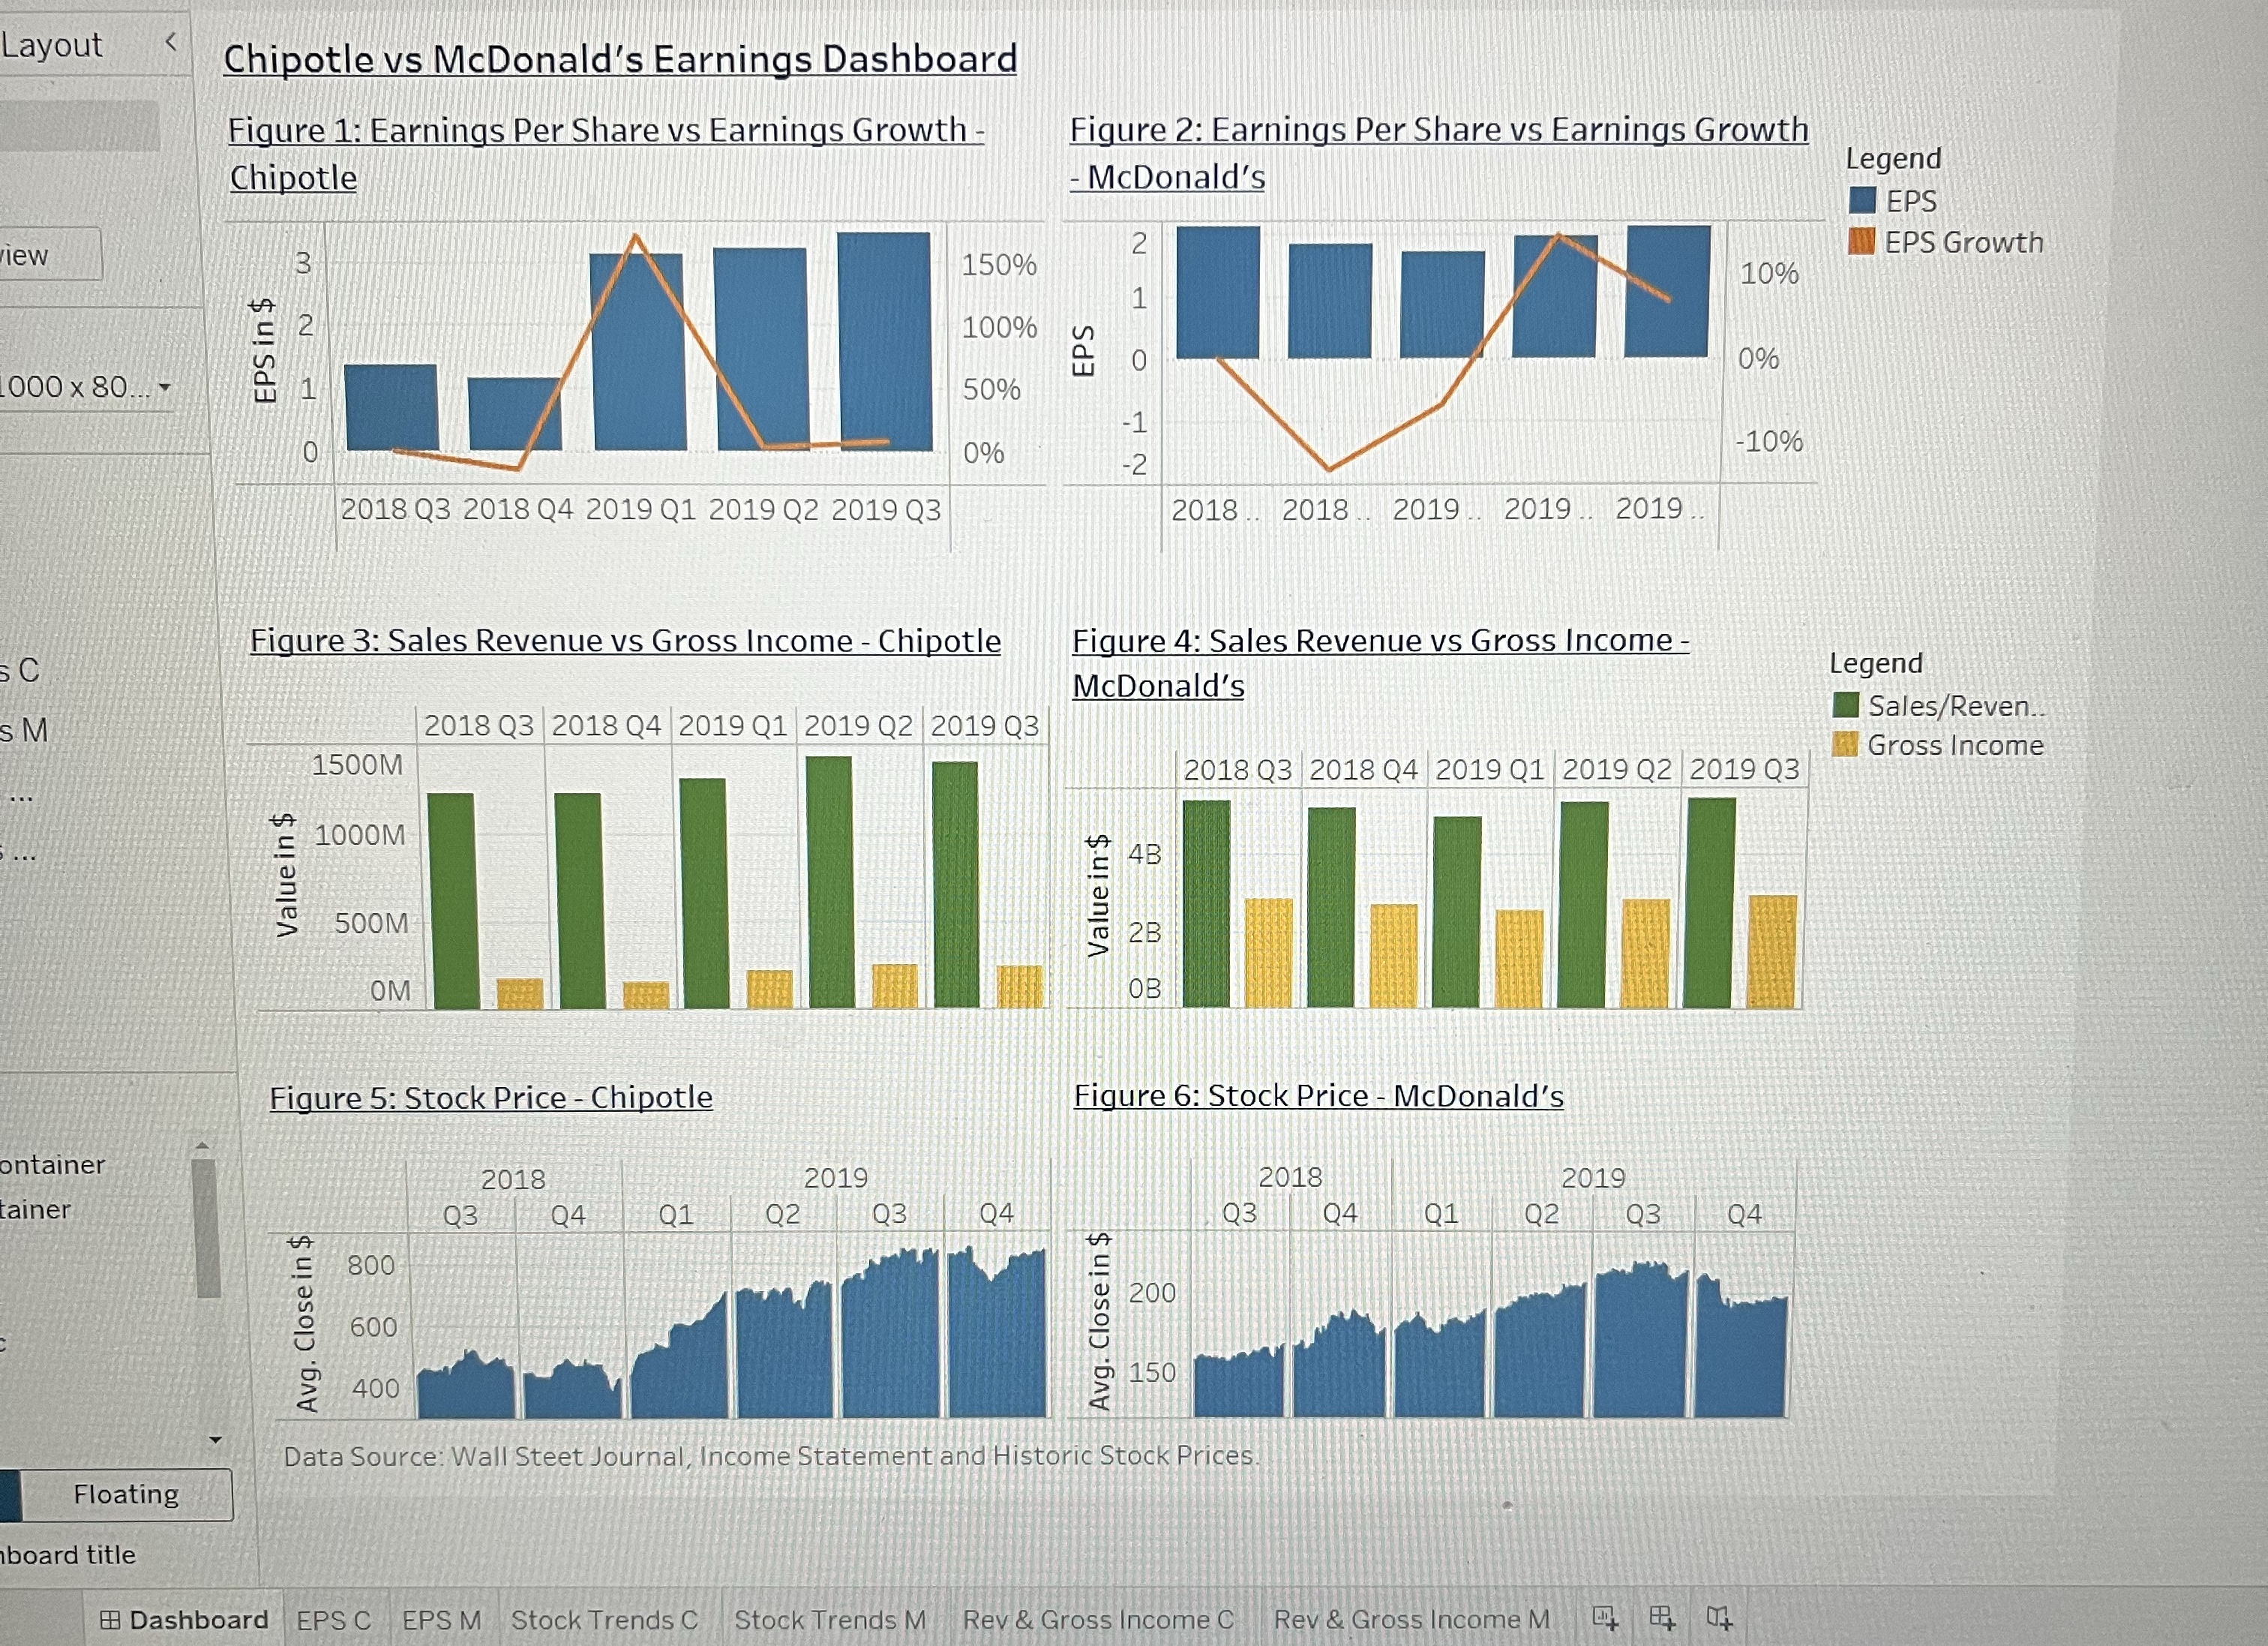
You are a data analyst at Chipotle and the Nasdaq headline, "Why Are Chipotle Shares Sinking After Strong Earnings" has caused a lot of concern within the company. Investors are worried about their investments. Chipotle's executives would like to understand if their competition also experienced a similar effect. The manager of data analytics prepares a data visualization dashboard using data from income statements and historic stock prices to explain to executives how earnings and stock prices compare with Chipotle's competitor, McDonald's. The manager has asked you to analyze that data and prepare your findings for a presentation to the board.
After reviewing the Data Visualization in Tableau, answer the following questions:
How would you summarize the earnings dashboard findings to your manager? How would you explain why earning per share increased but the stock price dropped?
Explain the concept of "quality of earnings"? Based on the data in the earnings dashboard, is there any evidence that Chipotle's quality of earnings affected its share price in Q
Are there similarities with Chipotle's and McDonald's stock price trend? What factors could be attributed to the trend?
BALANCE SHEET Data Visualization file kieso chAIA tableau visualization.twbx
In this next part, you'll be visualizing and interpreting data regarding Current Ratio vs Current Cash Debt Coverage and Profit Margin on Sales vs Payout Ratio from select DOW companies.
What conclusions can be drawn from the coverage ratios on the dashboard. Are there any concerns with the current ratio and the current cash debt coverage?
What conclusions can be drawn from the profitability ratios on the dashboard?
Layout
Chipotle vs McDonald's Earnings Dashboard
Figure : Earnings Per Share vs Earnings Growth
Chipotle
Figure : Earnings Per Share vs Earnings Growth
McDonald's
Legend
EPS
EPS Growth
McDonald's
Legend
clesReven
oss Income
Figure : Stock PriceChipotle
Figure : Stock PriceMcDonald's
ontainer
tainer
Floating
board title
Dashboard
EPS C
EPSM
Stock Trends C
Stock Trends M
Rev & Gross Income C
Rev & Gross Income M
Step by Step Solution
There are 3 Steps involved in it
1 Expert Approved Answer
Step: 1 Unlock

Question Has Been Solved by an Expert!
Get step-by-step solutions from verified subject matter experts
Step: 2 Unlock
Step: 3 Unlock