

Question: the excell part is something i will do on my end! i just need help with steps on how to get to the solutions Using
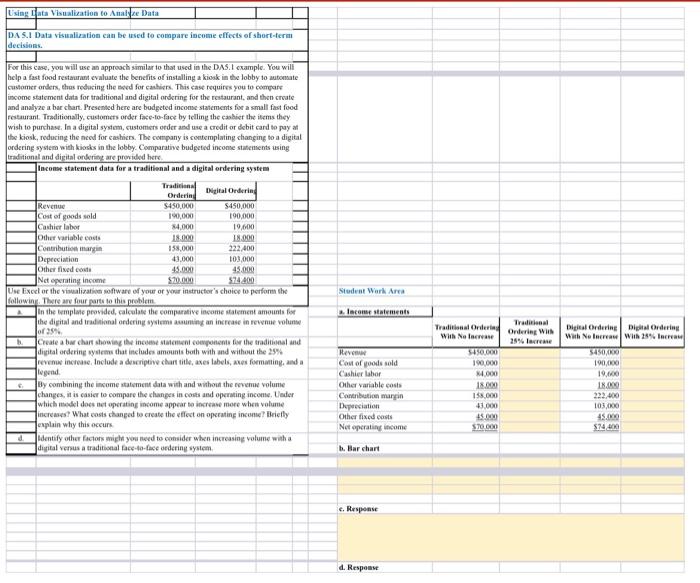
Using Data Visualization to Anale Data DA 5.1 Data visualization can be used to compare income effects of short-term decisions. For this case, you will use an approach similar to that used in the DAS. cxample. You will help a fast food restaurant evaluate the benefits of installing a kiosk in the lobby to automate customer orders, thus reducing the weed for cashiers. This case requires you to compare income statement data for traditional and digital ordering for the restaurant and then croute and analyze u bar chart. Presented here are budgeted income statements for a small fast food restaurant. Traditionally, customers order face-to-face by telling the caobiet the items they wish to purchase. In a digital system, customers onder and use a credit or debit card to pay at the kiosk, reducing the need for cashies. The company is contemplating changing to a digital ordering system with kiosks in the lobby. Comparative budgeted income statements using traditional and digital ordering are provided here Income statement data for a traditional and a digital ordering system Trading EigitalOrdering Ordering Revenue $450,000 $450,000 Cost of goods sold 190,000 190,000 Cashier labor 84.000 19.000 other variable code 18.000 18.000 Contributi marin 158,000 222.400 Depreciation 13.000 103,000 Other fined con 45.000 45.000 Net operating income $20.000 5724400 Use Excel or the Salization software of your or your instructor's choice to perform the following. There are four parts to this problem in the template provided, calculate the comparative income statement amounts for the digital and traditional ordering munting an increase in revenue volum Jor 25% Create a bur chart showing the income statement componenter the traditional and digital ordering system that includes amounts both with and without the 25% revenue increase Include a descriptive chart title, axes labels, axes formatting, and a legend juy combining the income statement data with and without the revieme volume changes, it is casier to compare the changes in costs and operating income Under which model does not operating income appear to increase more when volume increases? What costs changed to create the effect on operating income rictly explain why this cours Identify other factors might you need to consider when increasing volume with a digital versus a traditional face-to-face ordering system Student Work Area Income statements Traditional Order With No Increase Traditional Ordering with 28% lacreate Digital Ordering Big Ordering With No Increase with 25% Increase 5450 190.000 Hem Cart of goods sold Cashier labor Other variable costs Contribution margin Depreciation Other fixed costs Net operating income 5450000 190.000 M400 18.00 158.000 43.000 45.000 570.000 19.000 18.00 222.000 103,000 45.00 5740 h. Bar chart c. Response d. Response Using Data Visualization to Anale Data DA 5.1 Data visualization can be used to compare income effects of short-term decisions. For this case, you will use an approach similar to that used in the DAS. cxample. You will help a fast food restaurant evaluate the benefits of installing a kiosk in the lobby to automate customer orders, thus reducing the weed for cashiers. This case requires you to compare income statement data for traditional and digital ordering for the restaurant and then croute and analyze u bar chart. Presented here are budgeted income statements for a small fast food restaurant. Traditionally, customers order face-to-face by telling the caobiet the items they wish to purchase. In a digital system, customers onder and use a credit or debit card to pay at the kiosk, reducing the need for cashies. The company is contemplating changing to a digital ordering system with kiosks in the lobby. Comparative budgeted income statements using traditional and digital ordering are provided here Income statement data for a traditional and a digital ordering system Trading EigitalOrdering Ordering Revenue $450,000 $450,000 Cost of goods sold 190,000 190,000 Cashier labor 84.000 19.000 other variable code 18.000 18.000 Contributi marin 158,000 222.400 Depreciation 13.000 103,000 Other fined con 45.000 45.000 Net operating income $20.000 5724400 Use Excel or the Salization software of your or your instructor's choice to perform the following. There are four parts to this problem in the template provided, calculate the comparative income statement amounts for the digital and traditional ordering munting an increase in revenue volum Jor 25% Create a bur chart showing the income statement componenter the traditional and digital ordering system that includes amounts both with and without the 25% revenue increase Include a descriptive chart title, axes labels, axes formatting, and a legend juy combining the income statement data with and without the revieme volume changes, it is casier to compare the changes in costs and operating income Under which model does not operating income appear to increase more when volume increases? What costs changed to create the effect on operating income rictly explain why this cours Identify other factors might you need to consider when increasing volume with a digital versus a traditional face-to-face ordering system Student Work Area Income statements Traditional Order With No Increase Traditional Ordering with 28% lacreate Digital Ordering Big Ordering With No Increase with 25% Increase 5450 190.000 Hem Cart of goods sold Cashier labor Other variable costs Contribution margin Depreciation Other fixed costs Net operating income 5450000 190.000 M400 18.00 158.000 43.000 45.000 570.000 19.000 18.00 222.000 103,000 45.00 5740 h. Bar chart c. Response d. Response
Step by Step Solution
There are 3 Steps involved in it

Get step-by-step solutions from verified subject matter experts