

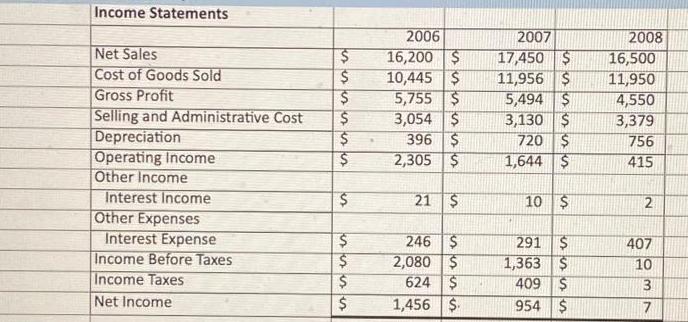
Income Statements Net Sales Cost of Goods Sold Gross Profit Selling and Administrative Cost Depreciation Operating...
Fantastic news! We've Found the answer you've been seeking!
Question:
Expert Answer:
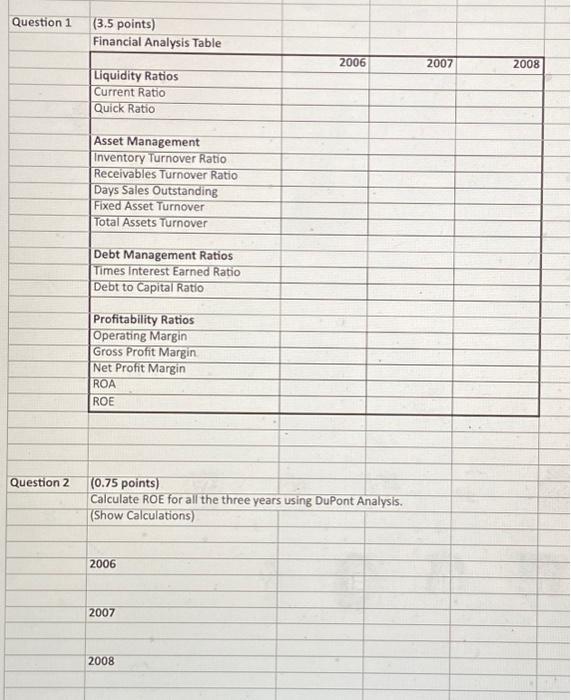
Lets begin by calculating the financial ratios as requested in the table for Question 1 We will use the provided Income Statements and Balance Sheets for the years 2006 2007 and 2008 Liquidity Ratios ... View the full answer

Related Book For 
Financial Reporting Financial Statement Analysis and Valuation
ISBN: 978-0324302950
6th edition
Authors: Clyde P. Stickney
Posted Date:
