

Question: Independent Samples Test Levene's Test for Equally Variantes test for Equality of Means F Siq sig tiled 015 Mean Difference -7.30000 df 18 95% Confidence
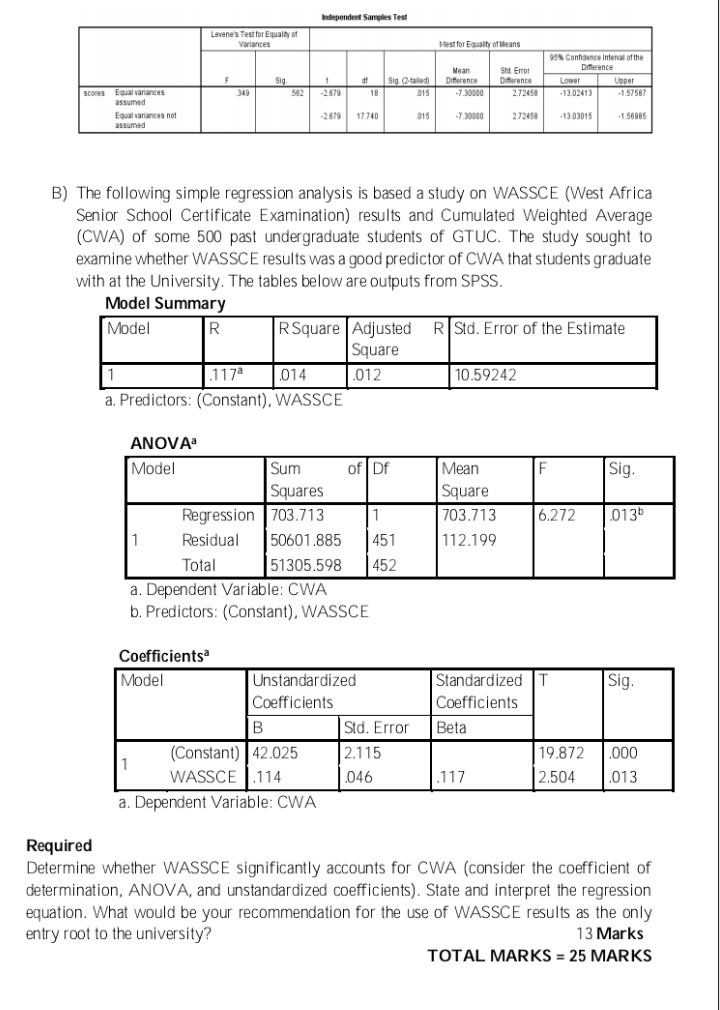
Independent Samples Test Levene's Test for Equally Variantes test for Equality of Means F Siq sig tiled 015 Mean Difference -7.30000 df 18 95% Confidence interval of the Difference Lower Upper - 13.02413 -1.57587 SM Error Difference 2.72456 SCOS 349 562 -2.679 Equal vanances assumed Equal variances not assumed -2.679 17.740 015 -730000 2.72458 - 13.0301 -1.56989 B) The following simple regression analysis is based a study on WASSCE (West Africa Senior School Certificate Examination) results and Cumulated Weighted Average (CWA) of some 500 past undergraduate students of GTUC. The study sought to examine whether WASSCE results was a good predictor of CWA that students graduate with at the University. The tables below are outputs from SPSS. Model Summary Model RSquare Adjusted RStd. Error of the Estimate Square .117 .014 .012 10.59242 a. Predictors: (Constant), WASSCE Sig. Mean Square 703.713 112.199 1 6.272 ANOVA Model Sum ofDf Squares Regression 703.713 Residual 50601.885 451 Total 51305.598 452 a. Dependent Variable: CWA b. Predictors: (Constant), WASSCE .0136 1 Sig. Coefficientsa Model Unstandardized Coefficients B Std. Error (Constant) 42.025 2.115 WASSCE.114 .046 a. Dependent Variable: CWA Standardized T Coefficients Beta 19.872 2.504 .000 .013 .117 Required Determine whether WASSCE significantly accounts for CWA (consider the coefficient of determination, ANOVA, and unstandardized coefficients). State and interpret the regression equation. What would be your recommendation for the use of WASSCE results as the only entry root to the university? 13 Marks TOTAL MARKS = 25 MARKS Independent Samples Test Levene's Test for Equally Variantes test for Equality of Means F Siq sig tiled 015 Mean Difference -7.30000 df 18 95% Confidence interval of the Difference Lower Upper - 13.02413 -1.57587 SM Error Difference 2.72456 SCOS 349 562 -2.679 Equal vanances assumed Equal variances not assumed -2.679 17.740 015 -730000 2.72458 - 13.0301 -1.56989 B) The following simple regression analysis is based a study on WASSCE (West Africa Senior School Certificate Examination) results and Cumulated Weighted Average (CWA) of some 500 past undergraduate students of GTUC. The study sought to examine whether WASSCE results was a good predictor of CWA that students graduate with at the University. The tables below are outputs from SPSS. Model Summary Model RSquare Adjusted RStd. Error of the Estimate Square .117 .014 .012 10.59242 a. Predictors: (Constant), WASSCE Sig. Mean Square 703.713 112.199 1 6.272 ANOVA Model Sum ofDf Squares Regression 703.713 Residual 50601.885 451 Total 51305.598 452 a. Dependent Variable: CWA b. Predictors: (Constant), WASSCE .0136 1 Sig. Coefficientsa Model Unstandardized Coefficients B Std. Error (Constant) 42.025 2.115 WASSCE.114 .046 a. Dependent Variable: CWA Standardized T Coefficients Beta 19.872 2.504 .000 .013 .117 Required Determine whether WASSCE significantly accounts for CWA (consider the coefficient of determination, ANOVA, and unstandardized coefficients). State and interpret the regression equation. What would be your recommendation for the use of WASSCE results as the only entry root to the university? 13 Marks TOTAL MARKS = 25 MARKS
Step by Step Solution
There are 3 Steps involved in it
1 Expert Approved Answer
Step: 1 Unlock

Question Has Been Solved by an Expert!
Get step-by-step solutions from verified subject matter experts
Step: 2 Unlock
Step: 3 Unlock