

Question: INDICATE FORECASTED/EXPECTED VALUES: A B D E F G H J K L M 1 2 2021* Country United States 3 3.6 7.3 4 China
 INDICATE FORECASTED/EXPECTED VALUES:
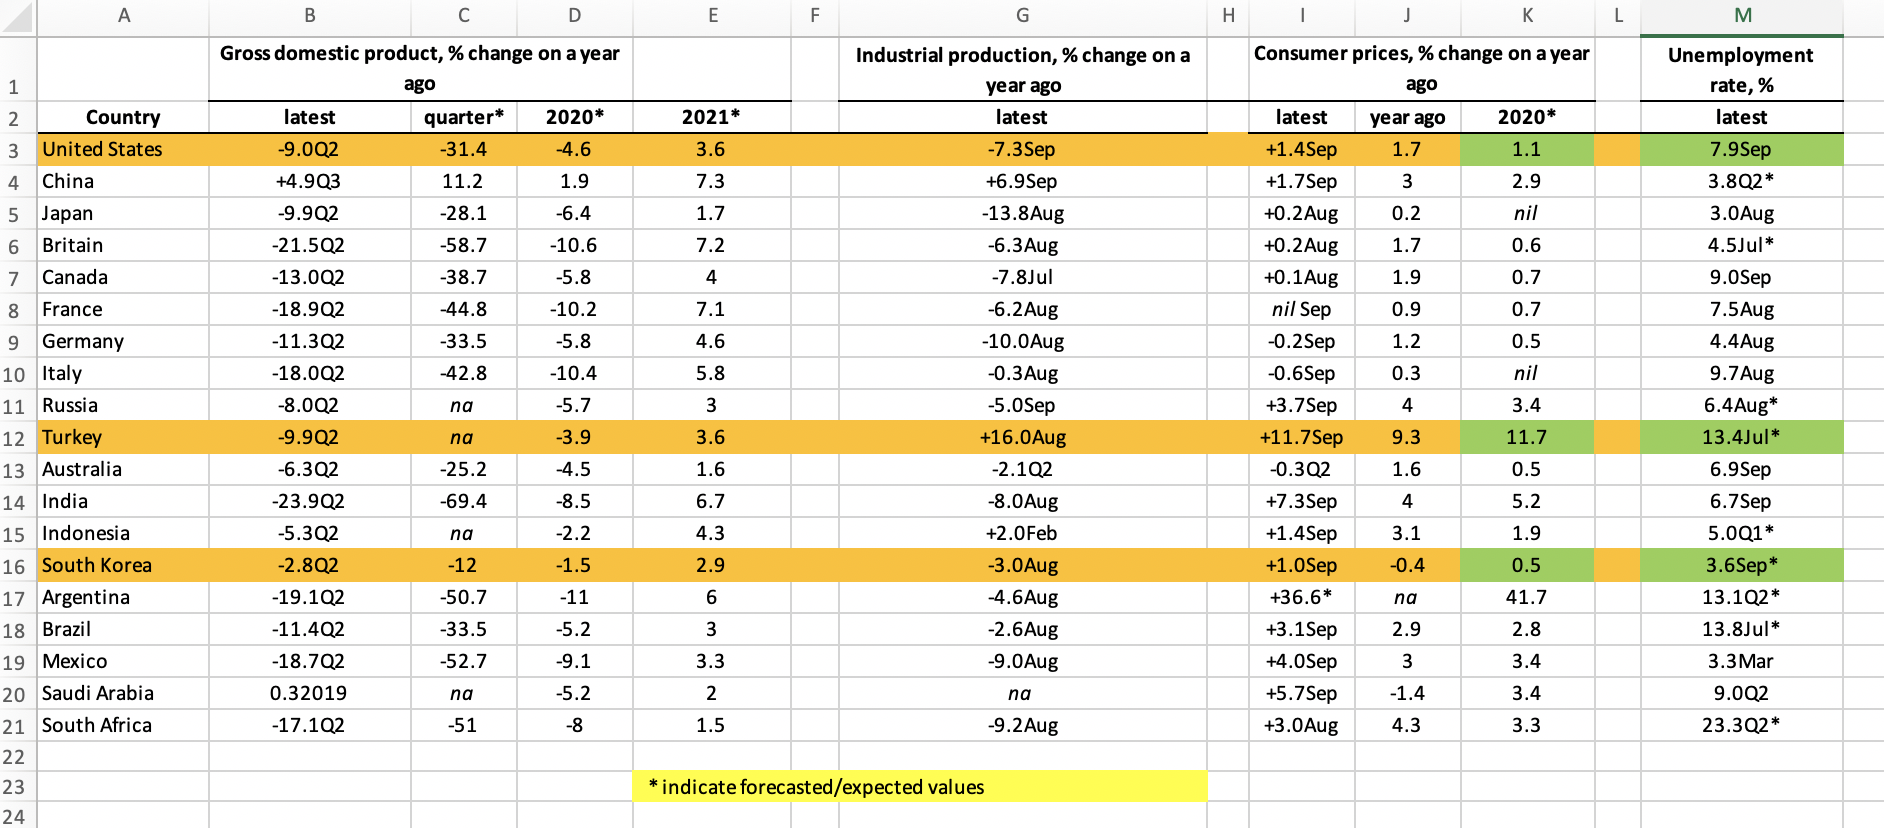
A B D E F G H J K L M 1 2 2021* Country United States 3 3.6 7.3 4 China 1.7 5 Japan 6 Britain 7 Canada 7.2 4 8 France 7.1 4.6 5.8 Industrial production, % change on a year ago latest -7.3 Sep +6.9 Sep -13.8 Aug -6.3 Aug -7.8Jul -6.2 Aug -10.0 Aug -0.3 Aug -5.0 Sep +16.0 Aug -2.1Q2 -8.0 Aug +2.0 Feb -3.0Aug -4.6 Aug -2.6 Aug -9.0 Aug Gross domestic product, % change on a year ago latest quarter* 2020* -9.0Q2 -31.4 -4.6 +4.903 11.2 1.9 -9.902 -28.1 -6.4 -21.5Q2 -58.7 -10.6 -13.002 -38.7 -5.8 -18.902 -44.8 -10.2 -11.302 -33.5 -5.8 -18.0Q2 -42.8 -10.4 -8.002 na -5.7 -9.9Q2 na -3.9 -6.302 -25.2 -4.5 -23.902 -69.4 -8.5 -5.3Q2 na -2.2 -2.8Q2 -12 -1.5 -19.1Q2 -50.7 -11 -11.402 -33.5 -5.2 -18.702 -52.7 -9.1 0.32019 na -5.2 -17.102 -51 -8 Consumer prices, % change on a year ago latest year ago 2020* +1.4Sep 1.7 1.1 +1.7 Sep 3 2.9 +0.2 Aug 0.2 nil +0.2 Aug 1.7 0.6 +0.1 Aug 1.9 0.7 nil Sep 0.9 0.7 -0.2 Sep 1.2 0.5 -0.6 Sep 0.3 nil +3.7 Sep 4 3.4 +11.7 Sep 9.3 11.7 -0.3Q2 1.6 0.5 +7.3 Sep 4 5.2 +1.4Sep 1.9 +1.0 Sep -0.4 +36.6* 41.7 +3.1 Sep 2.9 2.8 +4.0 Sep 3 3.4 +5.7 Sep -1.4 +3.0 Aug 3.3 Unemployment rate, % latest 7.9 Sep 3.8Q2* 3.0 Aug 4.5Jul* 9.0Sep 7.5 Aug 4.4Aug 9.7 Aug 6.4Aug* 13.4Jul* 6.9 Sep 6.7 Sep 5.0Q1* 3.6 Sep* 13.1Q2* 13.8Jul* 3.3 Mar 9.0Q2 23.302* 3 9 Germany 10 Italy 11 Russia 12 Turkey 13 Australia 14 India 15 Indonesia 16 South Korea 17 Argentina 18 Brazil 19 Mexico 20 Saudi Arabia 21 South Africa 22 23 24 3.6 1.6 6.7 4.3 2.9 3.1 0.5 6 3 3.3 2 na 3.4 1.5 -9.2 Aug 4.3 * indicate forecasted/expected values A B D E F G H J K L M 1 2 2021* Country United States 3 3.6 7.3 4 China 1.7 5 Japan 6 Britain 7 Canada 7.2 4 8 France 7.1 4.6 5.8 Industrial production, % change on a year ago latest -7.3 Sep +6.9 Sep -13.8 Aug -6.3 Aug -7.8Jul -6.2 Aug -10.0 Aug -0.3 Aug -5.0 Sep +16.0 Aug -2.1Q2 -8.0 Aug +2.0 Feb -3.0Aug -4.6 Aug -2.6 Aug -9.0 Aug Gross domestic product, % change on a year ago latest quarter* 2020* -9.0Q2 -31.4 -4.6 +4.903 11.2 1.9 -9.902 -28.1 -6.4 -21.5Q2 -58.7 -10.6 -13.002 -38.7 -5.8 -18.902 -44.8 -10.2 -11.302 -33.5 -5.8 -18.0Q2 -42.8 -10.4 -8.002 na -5.7 -9.9Q2 na -3.9 -6.302 -25.2 -4.5 -23.902 -69.4 -8.5 -5.3Q2 na -2.2 -2.8Q2 -12 -1.5 -19.1Q2 -50.7 -11 -11.402 -33.5 -5.2 -18.702 -52.7 -9.1 0.32019 na -5.2 -17.102 -51 -8 Consumer prices, % change on a year ago latest year ago 2020* +1.4Sep 1.7 1.1 +1.7 Sep 3 2.9 +0.2 Aug 0.2 nil +0.2 Aug 1.7 0.6 +0.1 Aug 1.9 0.7 nil Sep 0.9 0.7 -0.2 Sep 1.2 0.5 -0.6 Sep 0.3 nil +3.7 Sep 4 3.4 +11.7 Sep 9.3 11.7 -0.3Q2 1.6 0.5 +7.3 Sep 4 5.2 +1.4Sep 1.9 +1.0 Sep -0.4 +36.6* 41.7 +3.1 Sep 2.9 2.8 +4.0 Sep 3 3.4 +5.7 Sep -1.4 +3.0 Aug 3.3 Unemployment rate, % latest 7.9 Sep 3.8Q2* 3.0 Aug 4.5Jul* 9.0Sep 7.5 Aug 4.4Aug 9.7 Aug 6.4Aug* 13.4Jul* 6.9 Sep 6.7 Sep 5.0Q1* 3.6 Sep* 13.1Q2* 13.8Jul* 3.3 Mar 9.0Q2 23.302* 3 9 Germany 10 Italy 11 Russia 12 Turkey 13 Australia 14 India 15 Indonesia 16 South Korea 17 Argentina 18 Brazil 19 Mexico 20 Saudi Arabia 21 South Africa 22 23 24 3.6 1.6 6.7 4.3 2.9 3.1 0.5 6 3 3.3 2 na 3.4 1.5 -9.2 Aug 4.3 * indicate forecasted/expected values
Step by Step Solution
There are 3 Steps involved in it

Get step-by-step solutions from verified subject matter experts