

Question: Indicate which trait shows greater variability? Explain how you know. Descriptive Statistics N Minimum Maximum Mean Std. Deviation Q10_composite_one_four 372 1.00 7.00 4.3992 1.56806 Q10_composite_five_ten

Indicate which trait shows greater variability? Explain how you know.
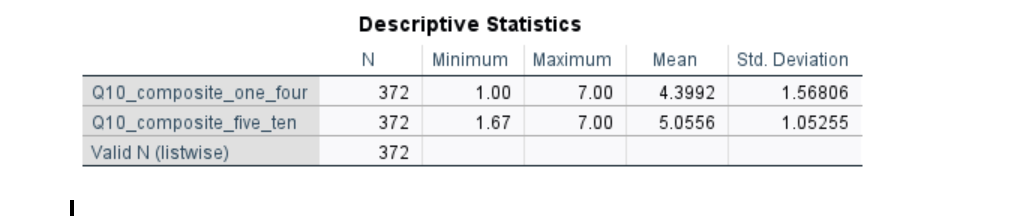
Descriptive Statistics N Minimum Maximum Mean Std. Deviation Q10_composite_one_four 372 1.00 7.00 4.3992 1.56806 Q10_composite_five_ten 372 1.67 7.00 5.0556 1.05255 Valid N (listwise) 372
Step by Step Solution
There are 3 Steps involved in it
1 Expert Approved Answer
Step: 1 Unlock

Question Has Been Solved by an Expert!
Get step-by-step solutions from verified subject matter experts
Step: 2 Unlock
Step: 3 Unlock