

Question: Individual Case Study (Due Week 7) This case study looks at the behavior of a circuit board process through the use of control charts. At
Individual Case Study (Due Week 7)
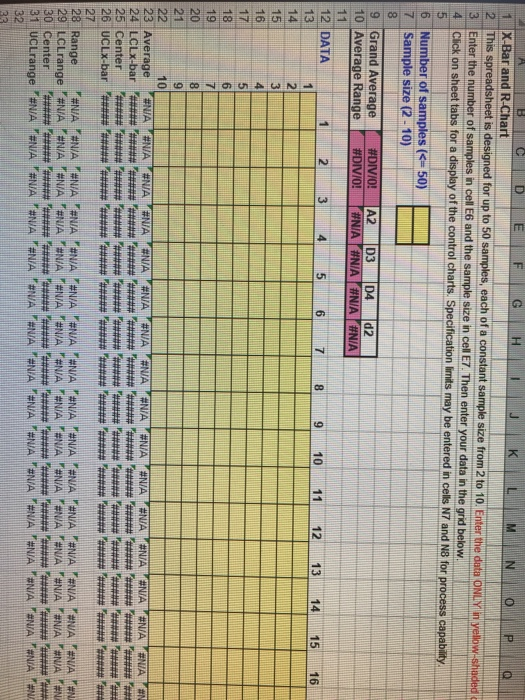
This case study looks at the behavior of a circuit board process through the use of control charts. At least two control charts will need to be constructed, and from them, you will be asked to provide an assessment of what you see. A template to facilitate the construction of the control charts has been provided in Files: GSCM326_Case_Study_Template.xlsx. You are not required to use this template; however, it will greatly facilitate the solution.
Problem Statement
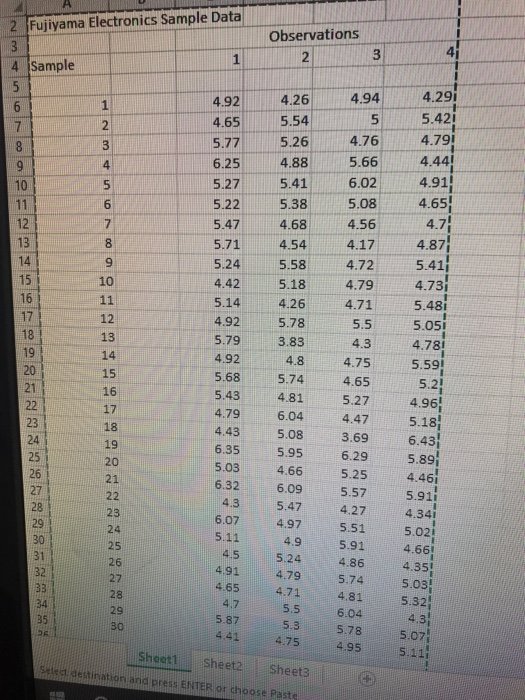
Fujiyama Electronics Inc. has had difficulties with circuit boards purchased from an outside supplier. Unacceptable variability occurs between two drilled holes that are supposed to be 5 cm apart on the circuit boards. Thirty samples of four boards each were taken from shipments from the supplier. The data obtained can be found on a worksheet in Files: Fujiyama_Electronics_Sample_Data.xlsx.
A tutorial is available to help complete the Week 7 Team Case Study assignment, titled WK7_Case_Study_Tutorial.
Guidelines
The student will submit the completed case study in a Word document Due Week 7.
The students will complete and answer the following questions.
- Calculate X-bar-bar, R-bar, and associated control limits using the data in the table above.
- Create x and R (average and range) control charts from the data in the table above.
- Discuss notable out-of-control conditions displayed in the completed x and R (average and range) control charts. Only consider points outside the control limits. Do not consider runs, set of points within certain zones, and so forth.
- If the conditions you note could be defined as assignable conditions, and they are removed from the process, then what will happen to the X-bar and R control chart?
- Remove the data related to the out-of-control points you observed from the original data, and recalculate new X-bar-bar, R-bar, and associated control limits.
- Create new X-bar and R (average and range) control charts from your updated data.
- Discuss how the two sets of control charts are different. What has changed?
Step by Step Solution
There are 3 Steps involved in it

Get step-by-step solutions from verified subject matter experts