

Question: Individual Paper Assignment #2 In this assignment, you will access the FRED (Federal Reserve Bank of St. Louis) database. I want you to create 2


Individual Paper Assignment #2
In this assignment, you will access the FRED (Federal Reserve Bank of St. Louis) database. I want you to create 2 or 3 tables/figures on a theme of your choosing. There are tens of thousands of variables in the database and you need to play around with it to find your interest. If you need help, let me know and I can give you some suggestions.
The goal of the assignment is for you to pick a theme. For example, you might choose "housing affordability." If so, you could chart the Case Schiller housing index for Nashville or other regions of your choice. You could also create a figure that shows home ownership rates over time for Davidson, Rutherford, Sumner, Williamson, Wilson, and any other counties. That would give you two graphics that you can download and insert into your analysis.
The paper will be 3-5page and include the following:
Introduction
-What theme will you explore? What is the public policy significance of this topic?
INSERT Graphic/Figure 1.
Explain what you and what it shows.
INSERT Graphic/Figure 2
Explain what you and what it shows
INSERT Graphic/Figure 3
Explain what you and what it shows
Conclusion
What story does your data tell? What suggestions might you have for future research?
How Inflation, GDP and CPI are related?
Figure. 1 Unemployment
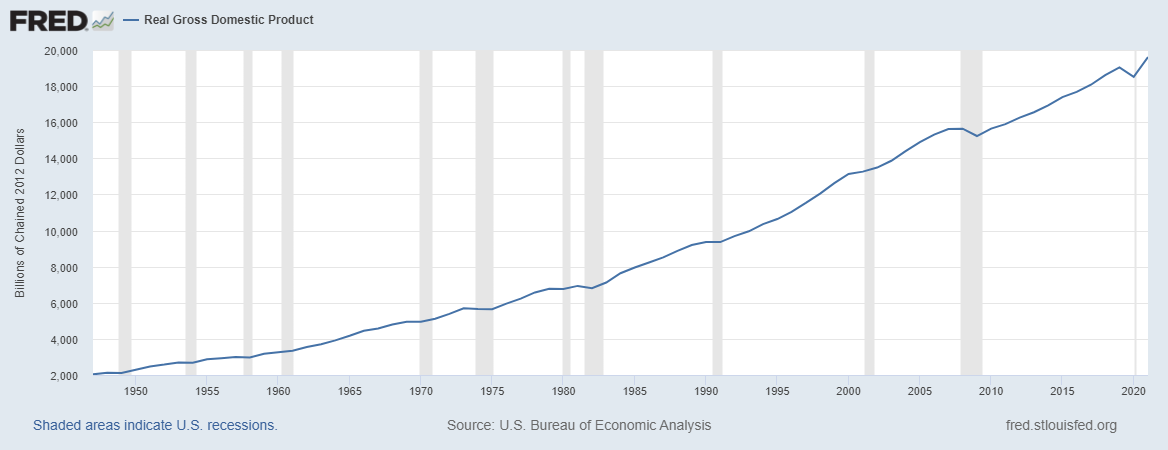
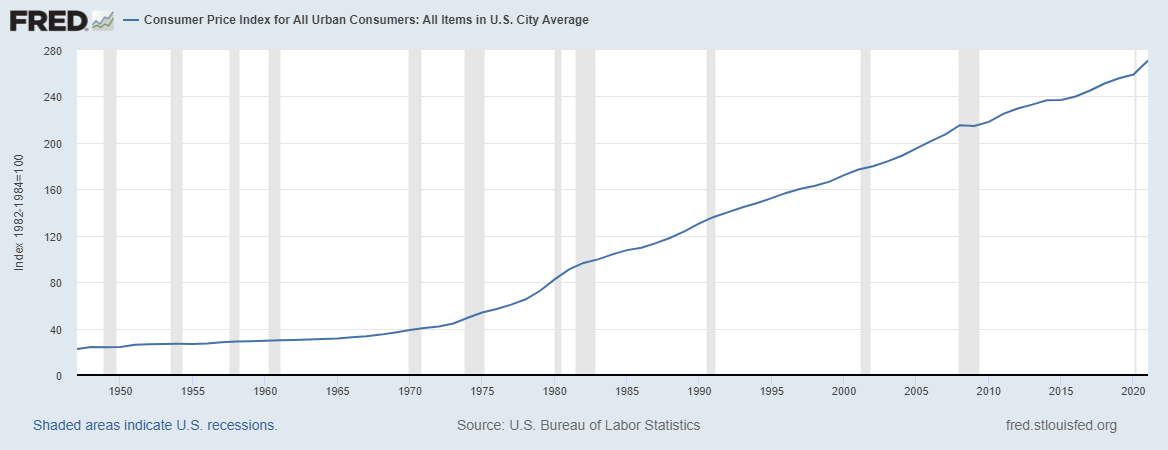
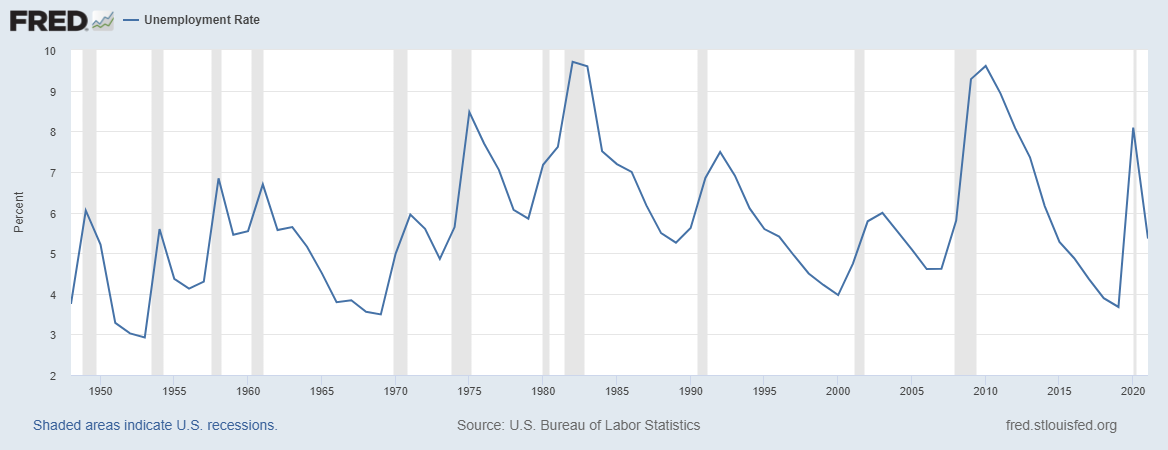
FRED ~ - Real Gross Domestic Product 20,000 18,000 16,000 14,000 12,000 Billions of Chained 2012 Dollars 10,000 8,000 6,000 4,000 2,000 1950 1955 1960 1965 1970 1975 1980 1985 1990 1995 2000 2005 2010 2015 2020 Shaded areas indicate U.S. recessions. Source: U.S. Bureau of Economic Analysis fred.stlouisfed.orgFRED - Consumer Price Index for All Urban Consumers: All Items in U.S. City Average 280 240 200 160 Index 1982-1984=100 120 80 40 0 2010 2015 2020 1950 1955 1960 1965 1970 1975 1980 1985 1990 1995 2000 2005 Shaded areas indicate U.S. recessions. Source: U.S. Bureau of Labor Statistics fred.stlouisfed.orgFRED ~ - Unemployment Rate 10 CO Percent 6 A 3 1950 1955 1960 1965 1970 1975 1980 1985 1990 1995 2000 2005 2010 2015 2020 Shaded areas indicate U.S. recessions. Source: U.S. Bureau of Labor Statistics fred.stlouisfed.org
Step by Step Solution
There are 3 Steps involved in it

Get step-by-step solutions from verified subject matter experts