

Question: Individual Project I. Standard scores 5: Correlation (all the data tables: 13 students only 61 using avg as )0 mm Xlobserved scores of test: all
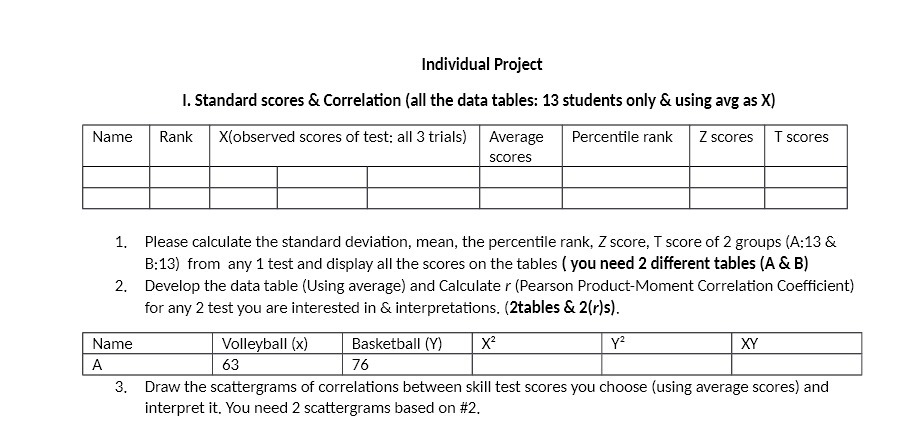
Individual Project I. Standard scores 5: Correlation (all the data tables: 13 students only 61 using avg as )0 mm Xlobserved scores of test: all 3 trials] Percentile rank scores 1. Please calculate the standard deviation, mean, the percentile rank, 2 score, T score of 2 groups {11:13 5: 3:13] from any 1 test and display all the scores on the tables [you need 2 different tables {A & B) 2, Develop the data table {Using average] and Calculate 1' [Pearson ProductMoment Correlation Coefcient} for any 2 test you are interested in & interpretations. [Ztables & 2M5}. W Volleyball ix} Basketball m 3. Draw the scattergrams of correlations between skill test scores you choose l[using average scores) and interpret it. You need 2 scattergrams based on #2
Step by Step Solution
There are 3 Steps involved in it

Get step-by-step solutions from verified subject matter experts