

Question: Individual Tax Return - IRS Examination Coverage There are several contributing factors which may ultimately trigger an audit of an Individual income tax return by
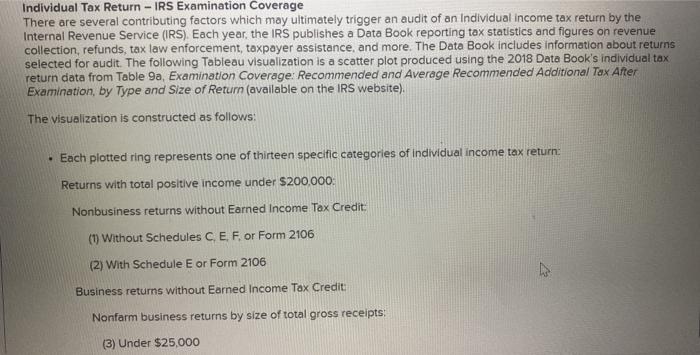
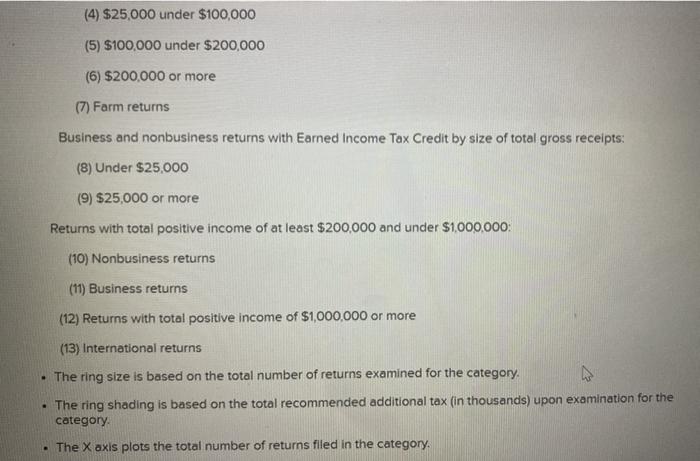


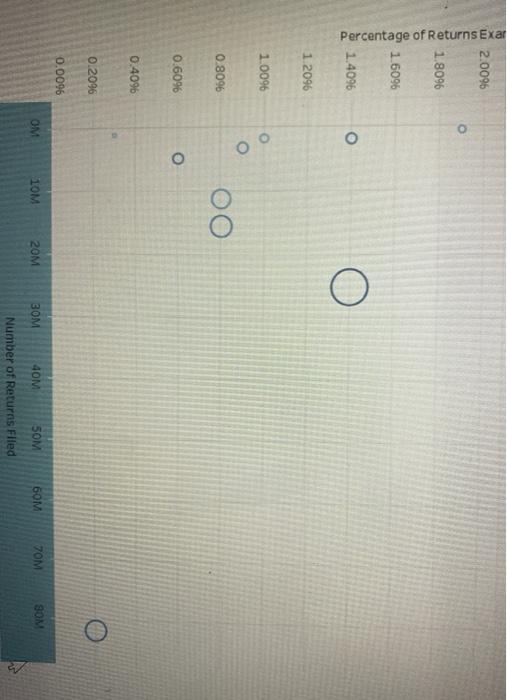

Individual Tax Return - IRS Examination Coverage There are several contributing factors which may ultimately trigger an audit of an Individual income tax return by the Internal Revenue Service (IRS). Each year, the IRS publishes a Data Book reporting tox statistics and figures on revenue collection, refunds, tax law enforcement, taxpayer assistance, and more. The Data Book includes information about returns selected for audit. The following Tableau visualization is a scatter plot produced using the 2018 Data Book's individual tax return data from Table 9a, Examination Coverage: Recommended and Average Recommended Additional Tax After Examination, by Type and Size of Return (available on the IRS website). The visualization is constructed as follows: Each plotted ring represents one of thirteen specific categories of individual income tax return; Returns with total positive income under $200,000. Nonbusiness returns without Earned Income Tax Credit: (1) Without Schedules C, E, F. or Form 2106 (2) With Schedule E or Form 2106 Business returns without Earned Income Tax Credit: Nonfarm business returns by size of total gross receipts! (3) Under $25,000 (4) $25,000 under $100,000 (5) $100,000 under $200,000 (6) $200,000 or more (7) Farm returns Business and nonbusiness returns with Earned Income Tax Credit by size of total gross receipts: (8) Under $25,000 (9) $25,000 or more Returns with total positive income of at least $200,000 and under $1,000,000 (10) Nonbusiness returns (11) Business returns (12) Returns with total positive income of $1,000,000 or more (13) International returns The ring size is based on the total number of returns examined for the category. The ring shading is based on the total recommended additional tax (in thousands) upon examination for the category - The X axis plots the total number of returns filled in the category. The Y axis plots the percentage of returns examined in the category Mouse over the visualization to reveal specific amounts for use in answering the following questions. Individual Tax Return IRS Examination Coverage 3.4096 3.2096 O 3.0096 2 8096 2.6096 2.4096 o ined 2 2096 2.0096 O 1.8096 Percentage of Returns Exar 16096 1.4096 1.2096 1.0096 O 0.8096 0.6096 o 0.4096 0.2096 0.0096 OM 10M 20M SOM 40M 50M 60M VOM SOM Number of Returns Flied Based on the visualization, why does filing a tax return with an Earned Income Tax Credit and a Schedule C with under $25.000 of total grous receipts Increase the likelihood of an examination? Individual Tax Return - IRS Examination Coverage There are several contributing factors which may ultimately trigger an audit of an Individual income tax return by the Internal Revenue Service (IRS). Each year, the IRS publishes a Data Book reporting tox statistics and figures on revenue collection, refunds, tax law enforcement, taxpayer assistance, and more. The Data Book includes information about returns selected for audit. The following Tableau visualization is a scatter plot produced using the 2018 Data Book's individual tax return data from Table 9a, Examination Coverage: Recommended and Average Recommended Additional Tax After Examination, by Type and Size of Return (available on the IRS website). The visualization is constructed as follows: Each plotted ring represents one of thirteen specific categories of individual income tax return; Returns with total positive income under $200,000. Nonbusiness returns without Earned Income Tax Credit: (1) Without Schedules C, E, F. or Form 2106 (2) With Schedule E or Form 2106 Business returns without Earned Income Tax Credit: Nonfarm business returns by size of total gross receipts! (3) Under $25,000 (4) $25,000 under $100,000 (5) $100,000 under $200,000 (6) $200,000 or more (7) Farm returns Business and nonbusiness returns with Earned Income Tax Credit by size of total gross receipts: (8) Under $25,000 (9) $25,000 or more Returns with total positive income of at least $200,000 and under $1,000,000 (10) Nonbusiness returns (11) Business returns (12) Returns with total positive income of $1,000,000 or more (13) International returns The ring size is based on the total number of returns examined for the category. The ring shading is based on the total recommended additional tax (in thousands) upon examination for the category - The X axis plots the total number of returns filled in the category. The Y axis plots the percentage of returns examined in the category Mouse over the visualization to reveal specific amounts for use in answering the following questions. Individual Tax Return IRS Examination Coverage 3.4096 3.2096 O 3.0096 2 8096 2.6096 2.4096 o ined 2 2096 2.0096 O 1.8096 Percentage of Returns Exar 16096 1.4096 1.2096 1.0096 O 0.8096 0.6096 o 0.4096 0.2096 0.0096 OM 10M 20M SOM 40M 50M 60M VOM SOM Number of Returns Flied Based on the visualization, why does filing a tax return with an Earned Income Tax Credit and a Schedule C with under $25.000 of total grous receipts Increase the likelihood of an examination
Step by Step Solution
There are 3 Steps involved in it

Get step-by-step solutions from verified subject matter experts