

Question: Required informationTableau Dashboard Activity 1 8 - 0 1 : Individual Tax Return IRS Examination Coverage ( Static ) Skip to questionIndividual Tax Return IRS
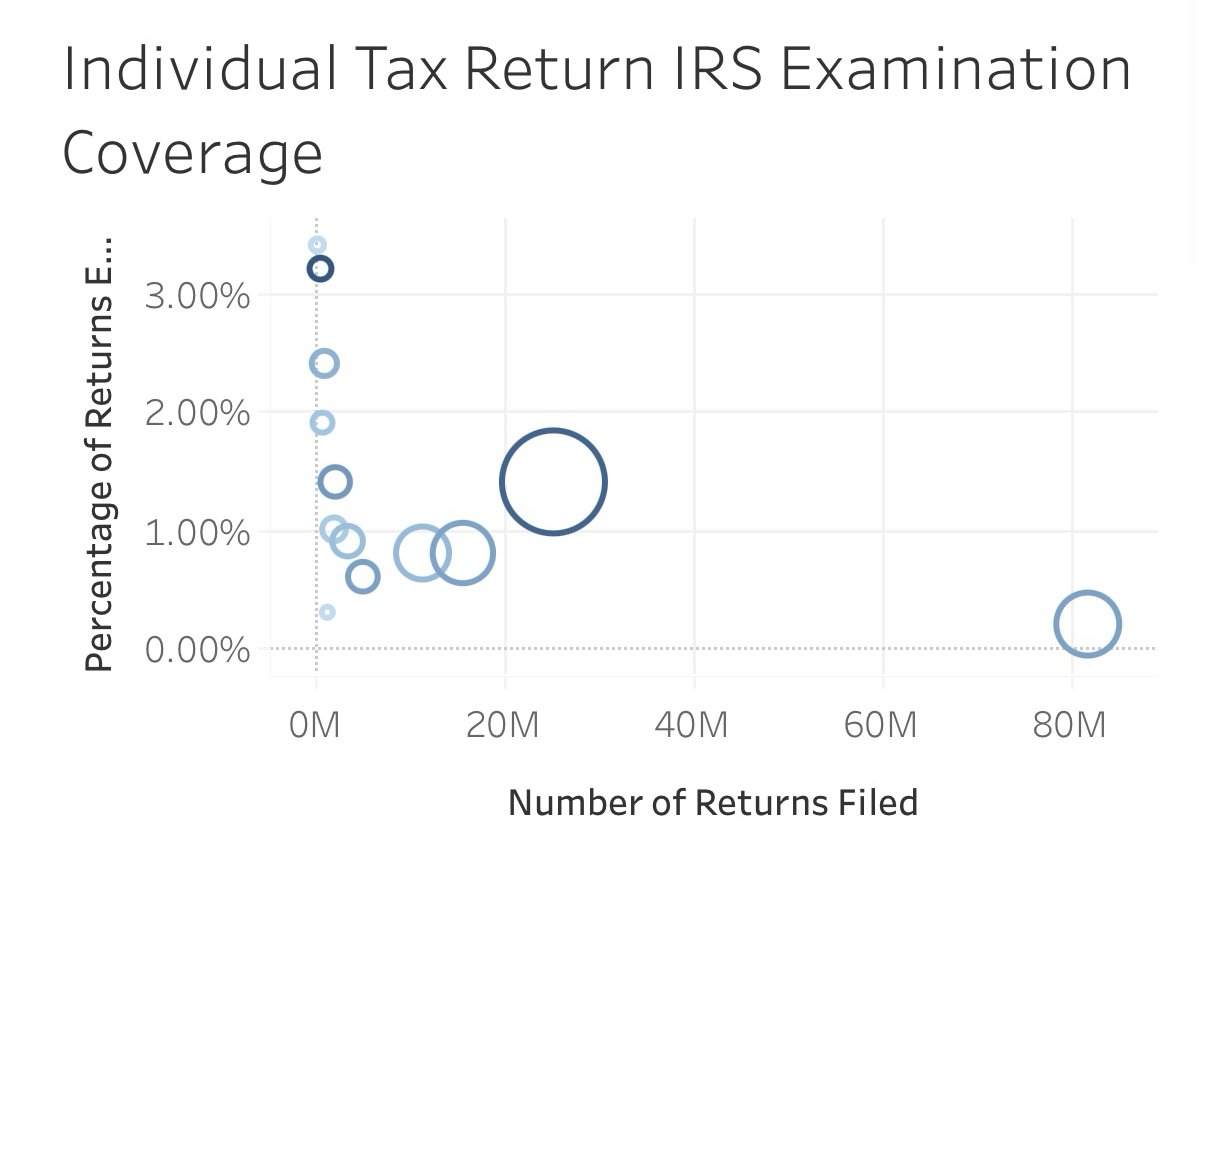
Required informationTableau Dashboard Activity : Individual Tax Return IRS Examination Coverage StaticSkip to questionIndividual Tax Return IRS Examination CoverageThere are several contributing factors which may ultimately trigger an audit of an Individual income tax return by the Internal Revenue Service IRS Each year, the IRS publishes a Data Book reporting tax statistics and figures on revenue collection, refunds, tax law enforcement, taxpayer assistance, and more. The Data Book includes information about returns selected for audit. The following Tableau visualization is a scatter plot produced using the Data Books individual tax return data from Table a Examination Coverage: Recommended and Average Recommended Additional Tax After Examination, by Type and Size of Return available on the IRS website The visualization is constructed as follows: Each plotted ring represents one of thirteen specific categories of individual income tax return: Returns with total positive income under $: Nonbusiness returns without Earned Income Tax Credit: Without Schedules C E F or Form With Schedule E or Form Business returns without Earned Income Tax Credit: Nonfarm business returns by size of total gross receipts: Under $ $ under $ $ under $ $ or more Farm returns Business and nonbusiness returns with Earned Income Tax Credit by size of total gross receipts: Under $ $ or more Returns with total positive income of at least $ and under $: Nonbusiness returns Business returns Returns with total positive income of $ or more International returnsThe ring size is based on the total number of returns examined for the category.The ring shading is based on the total recommended additional tax in thousands upon examination for the category.The X axis plots the total number of returns filed in the category.The Y axis plots the percentage of returns examined in the category. Mouse over the visualization to reveal specific amounts for use in answering the following questions. Individual Tax Return IRS Examination Coverage Part StaticBased on the visualization, why does filing a tax return with an Earned Income Tax Credit and a Schedule C with under $ of total gross receipts increase the likelihood of an examination
Individual Tax Return IRS Examination Coverage
Step by Step Solution
There are 3 Steps involved in it
1 Expert Approved Answer
Step: 1 Unlock

Question Has Been Solved by an Expert!
Get step-by-step solutions from verified subject matter experts
Step: 2 Unlock
Step: 3 Unlock