

Question
Information on last year's staffing and turnover is summarized in Table 1. You can assume this pattern will be continue. < +Table 14 Position
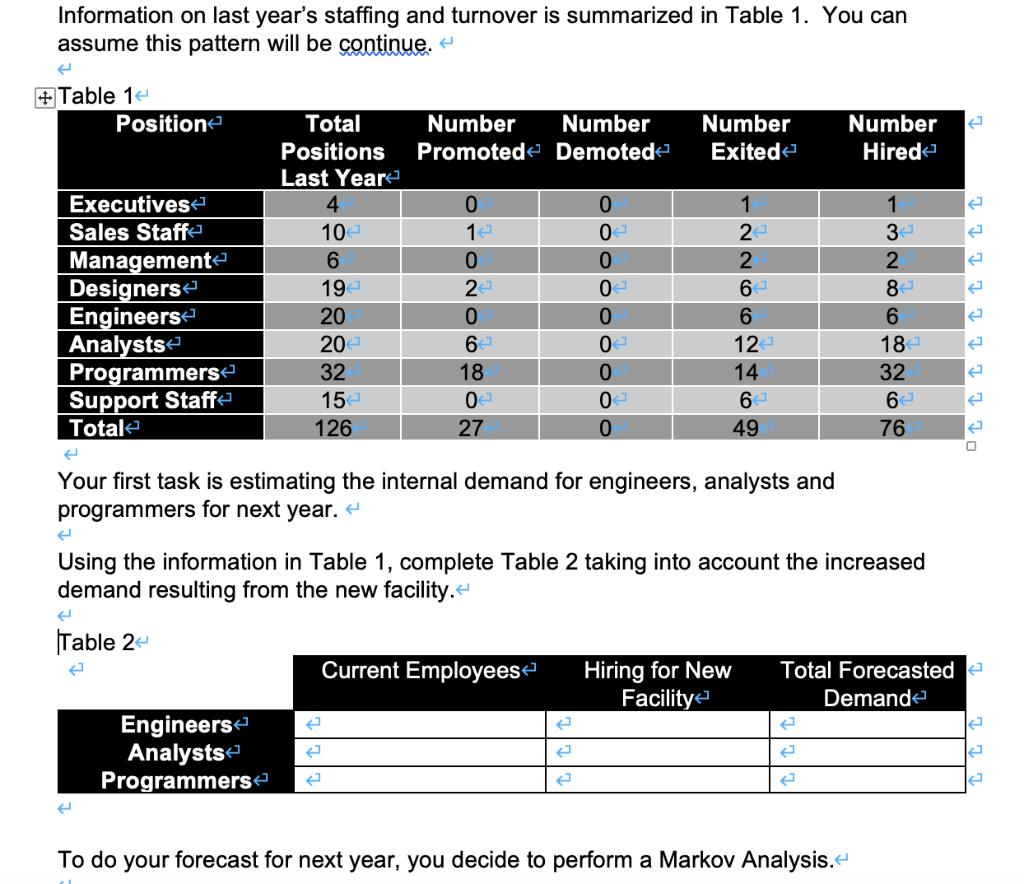
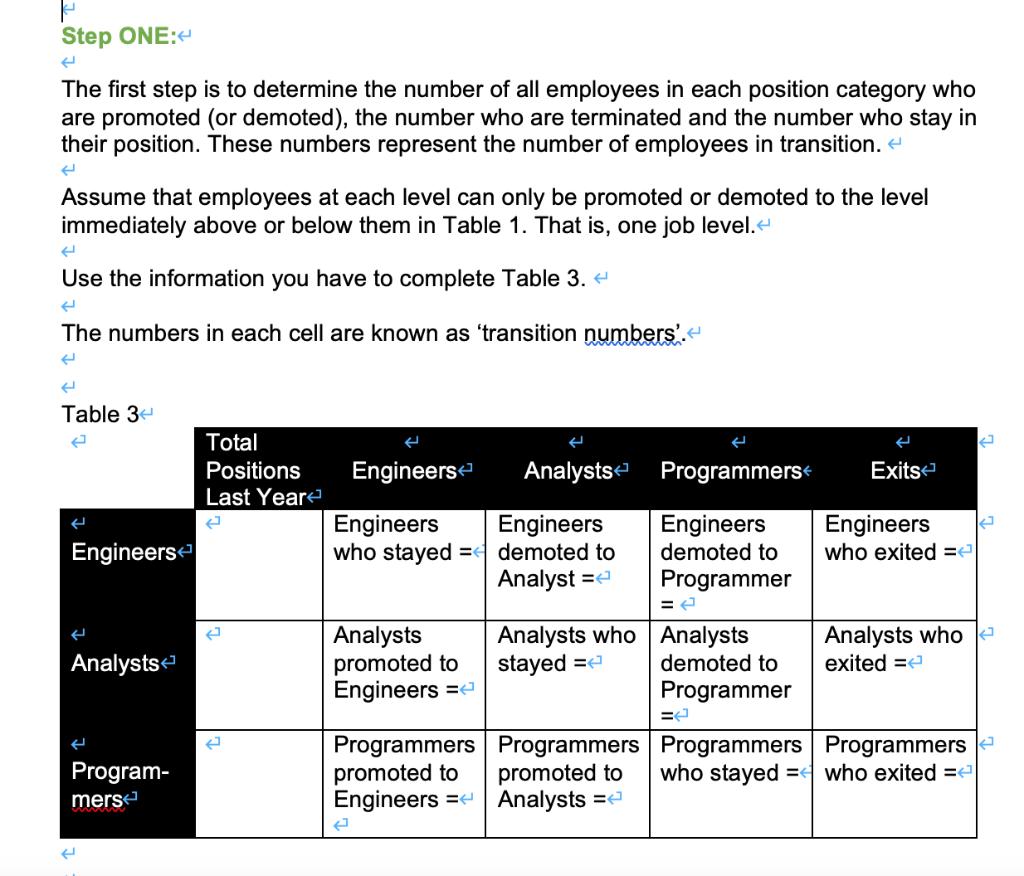
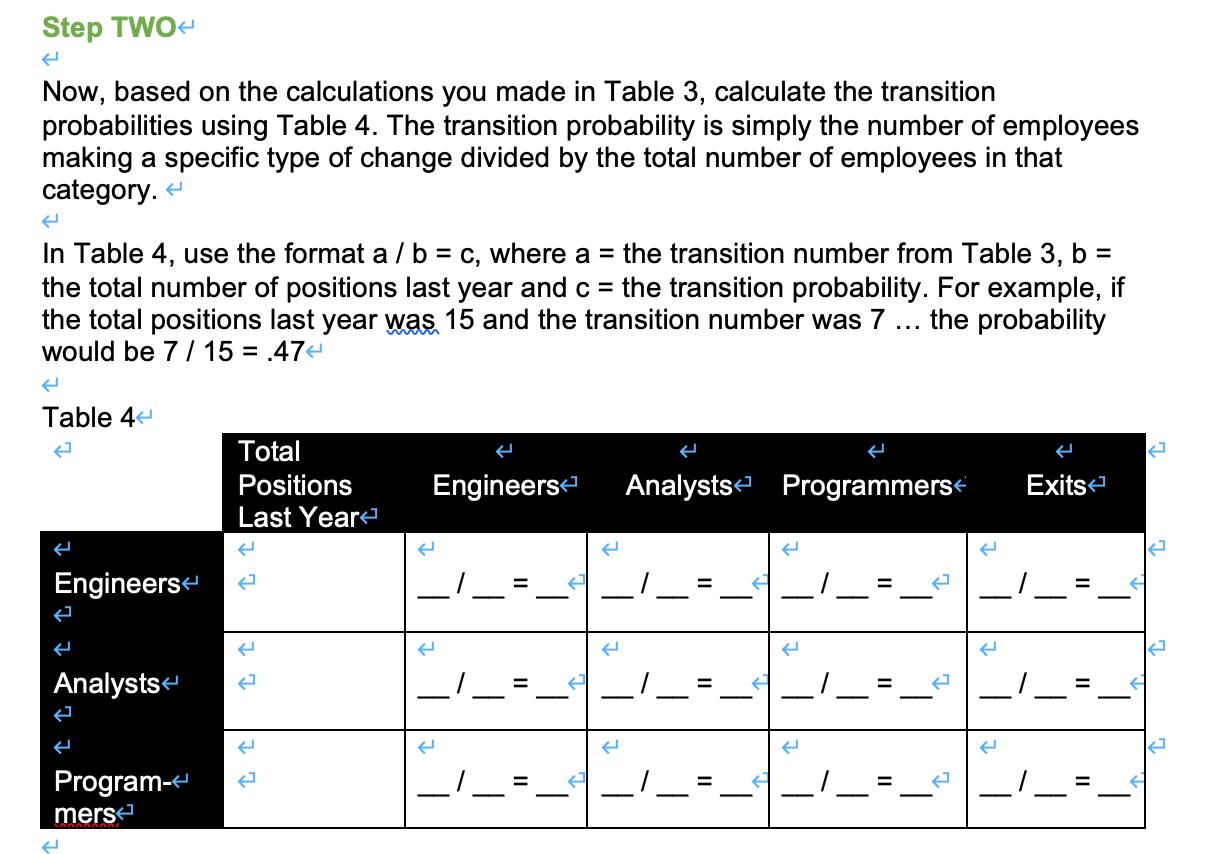
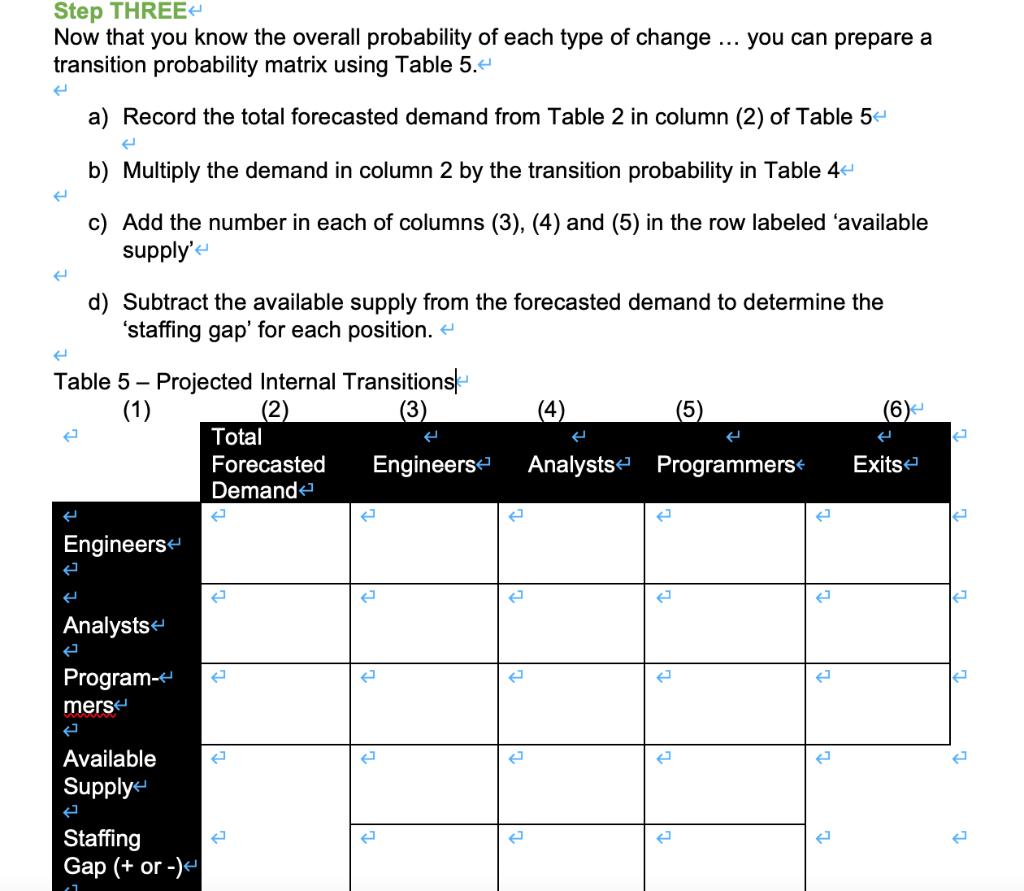
Information on last year's staffing and turnover is summarized in Table 1. You can assume this pattern will be continue. < +Table 14 Position Executives Sales Staff Management Designers Engineers Analysts Programmers Support Staff Total Total Positions Last Year 4 10 6 194 20 20 32 15 ( Table 24 126 Engineers Analysts Programmers Number Promoted 0 14 0 24 2 2 E 0 6 18 04 27 Number Number Demoted Exited Current Employees 0 0 0 0 0 0 0 0 0 1 Your first task is estimating the internal demand for engineers, analysts and programmers for next year. < P 2 1 20 2 6 6 124 14 6 49 Hiring for New Facility Using the information in Table 1, complete Table 2 taking into account the increased demand resulting from the new facility. < Number Hired J P 1 34 2 To do your forecast for next year, you decide to perform a Markov Analysis. < 1868 84 18 32 64 76 Total Forecasted Demand 2 P ott t t L LLL 2 P 2 Step ONE: < e The first step is to determine the number of all employees in each position category who are promoted (or demoted), the number who are terminated and the number who stay in their position. These numbers represent the number of employees in transition. < Assume that employees at each level can only be promoted or demoted to the level immediately above or below them in Table 1. That is, one job level. < ( Use the information you have to complete Table 3. < ( The numbers in each cell are known as 'transition numbers'. < e ( Table 3 e Engineers ( Analysts Program- mers H Total Positions Last Year E E Engineers Analysts Engineers Engineers who stayed = demoted to Analyst = < Analysts promoted to Engineers = Programmers promoted to Engineers = J Analysts who stayed = Programmers promoted to Analysts = Programmers Engineers demoted to Programmer Analysts demoted to Programmer = Exits Engineers who exited = Analysts who exited = Programmers Programmers who stayed = < who exited = E 2 2 Step TWO < 4 Now, based on the calculations you made in Table 3, calculate the transition probabilities using Table 4. The transition probability is simply the number of employees making a specific type of change divided by the total number of employees in that category. < In Table 4, use the format a / b = c, where a = the transition number from Table 3, b = the total number of positions last year and c = the transition probability. For example, if the total positions last year was 15 and the transition number was 7 the probability would be 7 / 15 = .47 < Table 4 ( Engineers Analysts ( Program- mers Total Positions Last Year ( L F Engineers N N K ... Analysts Programmers N N | 2 T Exits II 11 E 2 Step THREE Now that you know the overall probability of each type of change. you can prepare a transition probability matrix using Table 5. < E ( E E a) Record the total forecasted demand from Table 2 in column (2) of Table 5 ( ( Table 5 - Projected Internal Transitions (1) (3) Engineers 2 b) Multiply the demand in column 2 by the transition probability in Table 4 c) Add the number in each of columns (3), (4) and (5) in the row labeled 'available supply' Engineers d) Subtract the available supply from the forecasted demand to determine the 'staffing gap' for each position. < Analysts Program- mers Available Supply Staffing Gap (+ or -) < Total Forecasted Demand J 2 ( C 2 2 ... 2 (4) e Analysts Programmers 2 2 V E Exits Step FOUR Based on the above analysis, summarize your conclusions. What would you tell your client? And, considering the current external environment, what additional observations or recommendations would you make?
Step by Step Solution
3.52 Rating (128 Votes )
There are 3 Steps involved in it
Step: 1
Table 2 Engineers Analysts Programmers Current Employees 20 20 32 Hiring for New Facility 10 10 10 T...
Get Instant Access with AI-Powered Solutions
See step-by-step solutions with expert insights and AI powered tools for academic success
Step: 2

Step: 3
Ace Your Homework with AI
Get the answers you need in no time with our AI-driven, step-by-step assistance
Get Started
Foundations of Lodging Management
Authors: David K. Hayes, Jack D. Ninemeier, Allisha A. Miller.
2nd edition
132560895, 978-0132560894