

Question: Information Visualization Book: The Functional Art An introduction to information graphics and visualization Chapter 3 Is the following information visualization good? Why? What can you
Information Visualization
Book: The Functional Art An introduction to information graphics and visualization
Chapter 3
Is the following information visualization good? Why? What can you learn from it?
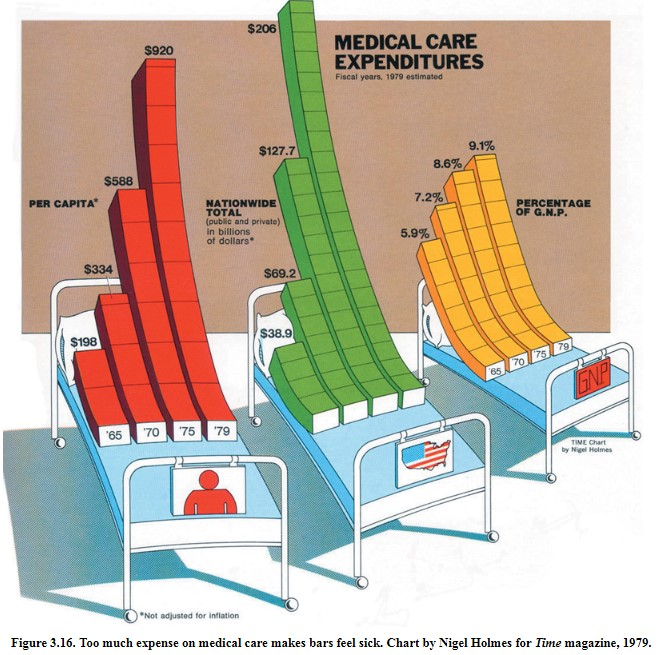
$206 MEDICAL CARE $920 EXPENDITURES Fiscal years, 1979 estimatod 9.1% $127.7 8.6% $588 7.2% PER CAPITA PERCENTAGE OF G.N.P. NATIONWIDE TOTAL (public and privato) in billions of dollars 5.9% $334 $69.2 S38.9 $198 75 70 65 7075 79 TINE Chart by Nigel Holmes Not adjusted for inflation Figure 3.16. Too much expense on medical care makes bars feel sick. Chart by Nigel Holmes for Iime magazine, 1979
Step by Step Solution
There are 3 Steps involved in it
1 Expert Approved Answer
Step: 1 Unlock

Question Has Been Solved by an Expert!
Get step-by-step solutions from verified subject matter experts
Step: 2 Unlock
Step: 3 Unlock