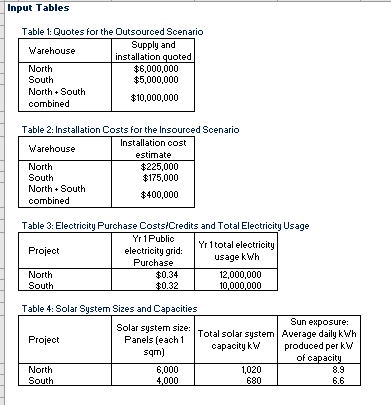
Question: Input Tables Table 1: Quotes for the Outsourced Scenario Warehouse : Supply and installation quoted North $6,000,000 South $5,000,000 North + South combined 10,000,000 Table
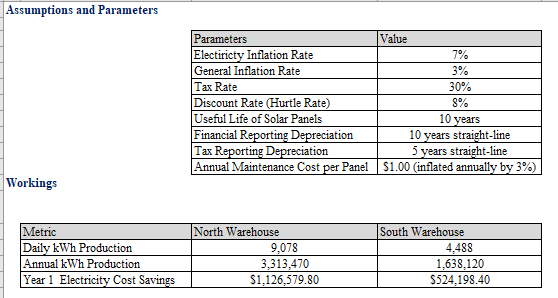
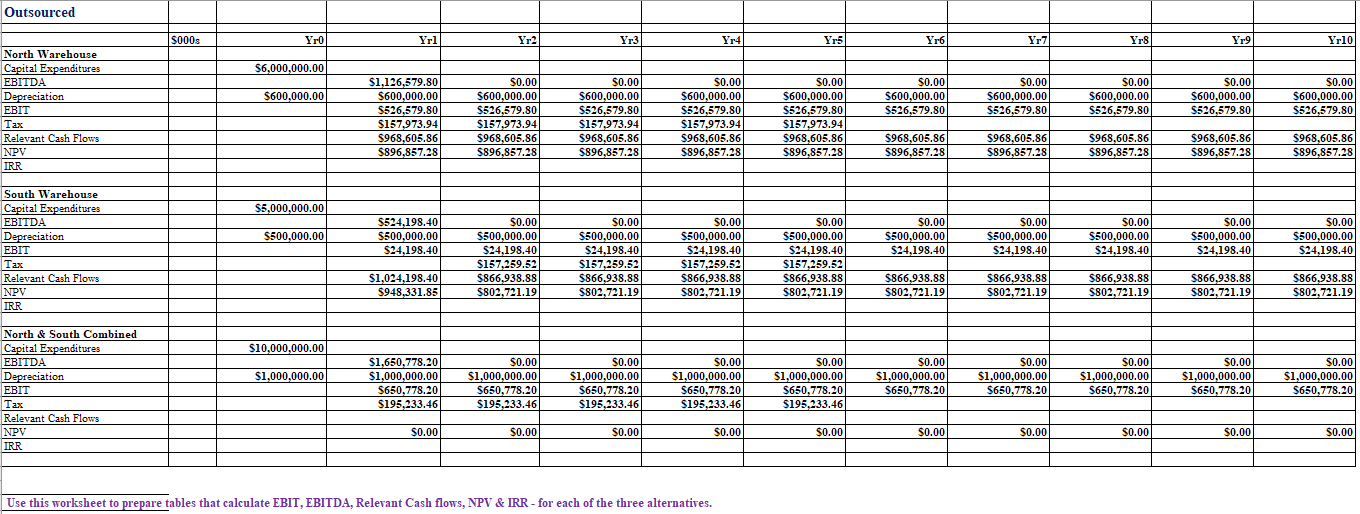
Input Tables Table 1: Quotes for the Outsourced Scenario Warehouse : Supply and installation quoted North $6,000,000 South $5,000,000 North + South combined 10,000,000 Table @: Installation Costs For the Insourced Scenario Installation Gast Warehouse : estimate North $225,000 South $175,000 North + South combined $400,000 Table 3: Electricity Purchase Costs!Credits and Total Electricity Usage . vr Public Tr total electricity Project electricity grid: usage kwh Purchase South $0.32 10,000,000 Table 4: Solar System Sizes and Capacities Sun enposure: Total solar system | Average daily kwh capacity kw produced per kw of capacit South 4.000 630 6.6 Solar system size: Project Panels [each 1 =qm] Assumptions and Parameters Electiricty Inflation Rate Ye General Inflation Fate Tax Rate TaxRate Discount Rate (Hurtle Rate) ; $1.00 (inflated annually by 3%) Workings North Warehouse South Warehouse Daily kWh Production 4488 Annual kWh Production 1,638,120 Year 1 Electricity Cost Savings $1,126,579.80 $524,198.40 Outsourced $000 Yr Yrl Yr2 Yr3 Yr4 Yr5 Yr6 Yr7 Yr8 Yr9 Yr10 North Warehouse Capital Expenditures $6.000.000.00 EBITDA $1,126,579.80 $0.00 $0.00 $0.00 $0.00 $0.00 $0.00 $0.00 $0.00 $0.00 Depreciation $600.000.00 $600,000.00 $600,000.00 $600.000.00 $600.000.00 $600,000.00 $600.000.00 $600,000.00 $600.000.00 $600,000.00 $600,000.00 EBIT $526,579.80 $526,579.80 $526,579.80 $526,579.80 $526,579.80 $526,579.80 $526,579.80 $526,579.80 $526,579.80 $526,579.80 Tax $157,973.94 $157,973.94 $157,973.94 $157,973.94 $157,973.94 Relevant Cash Flows $968,605.86 $968,605.86 $968,605.86 $968,605.86 $968.605.86 $968,605.86 $968,605.86 $968,605.86 $968,605.86 $968,605.86 NPV $896,857.28 $896,857.28 $896,857.28 $896,857.28 $896,857.28 $896,857.28 $896,857.28 $896,857.28 $896,857.28 $896,857.28 IRF South Warehouse Capital Expenditure $5,000,000.00 EBITDA $524,198.40 $0.00 $0.00 $0.00 $0.00 $0.00 $0.00 $0.00 $0.00 $0.00 Depreciation $500.000.00 $500,000.00 $500,000.00 $500,000.00 $500,000.00 $500,000.00 $500,000.00 $500,000.00 $500,000.00 $500,000.00 $500,000.00 EBIT $24,198.40 $24,198.40 $24,198.40 $24,198.40 $24,198.40 $24,198.40 $24,198.40 $24,198.40 $24,198.40 $24,198.40 Tax $157,259.52 $157,259.52 $157,259.52 $157,259.52 Relevant Cash Flows $1,024,198.40 $866,938.88 $866,938.88 $866,938.88 $866,938.88 $866,938.88 $866,938.88 $866,938.88 $866,938.88 $866,938.88 NPV $948,331.85 $802,721.19 $802,721.19 $802,721.19 $802.721.19 $802,721.19 $802,721.19 $802,721.19 $802,721.19 $802,721.19 IRR North & South Combined Capital Expenditures $10,000.000.00 EBITDA $1,650,778.20 $0.00 $0.00 $0.00 $0.00 $0.00 $0.00 $0.00 $0.00 $0.00 Depreciation $1.000.000.00 $1,000,000.00 $1,000,000.00 $1,000,000.00 $1,000,000.00 $1,000,000.00 $1,000,000.00 $1,000,000.00 $1,000,000.00 $1,000,000.00 $1,000,000.00 EBIT $650,778.20 $650,778.20 $650,778.20 $650,778.20 $650,778.20 $650,778.20 $650,778.20 $650,778.20 $650,778.20 $650,778.20 Tax $195,233.46 $195,233.46 $195,233.46 $195,233.46 $195,233.46 Relevant Cash Flows NP $0.00 $0.00 $0.0 $0.00 $0.00 $0.00 $0.00 $0.00 $0.00 $0.00 IRR Use this worksheet to prepare tables that calculate EBIT, EBITDA, Relevant Cash flows, NPV & IRR - for each of the three alternatives
Step by Step Solution
There are 3 Steps involved in it
1 Expert Approved Answer
Step: 1 Unlock
Question Has Been Solved by an Expert!
Get step-by-step solutions from verified subject matter experts
Step: 2 Unlock
Step: 3 Unlock
Students Have Also Explored These Related Accounting Questions!