

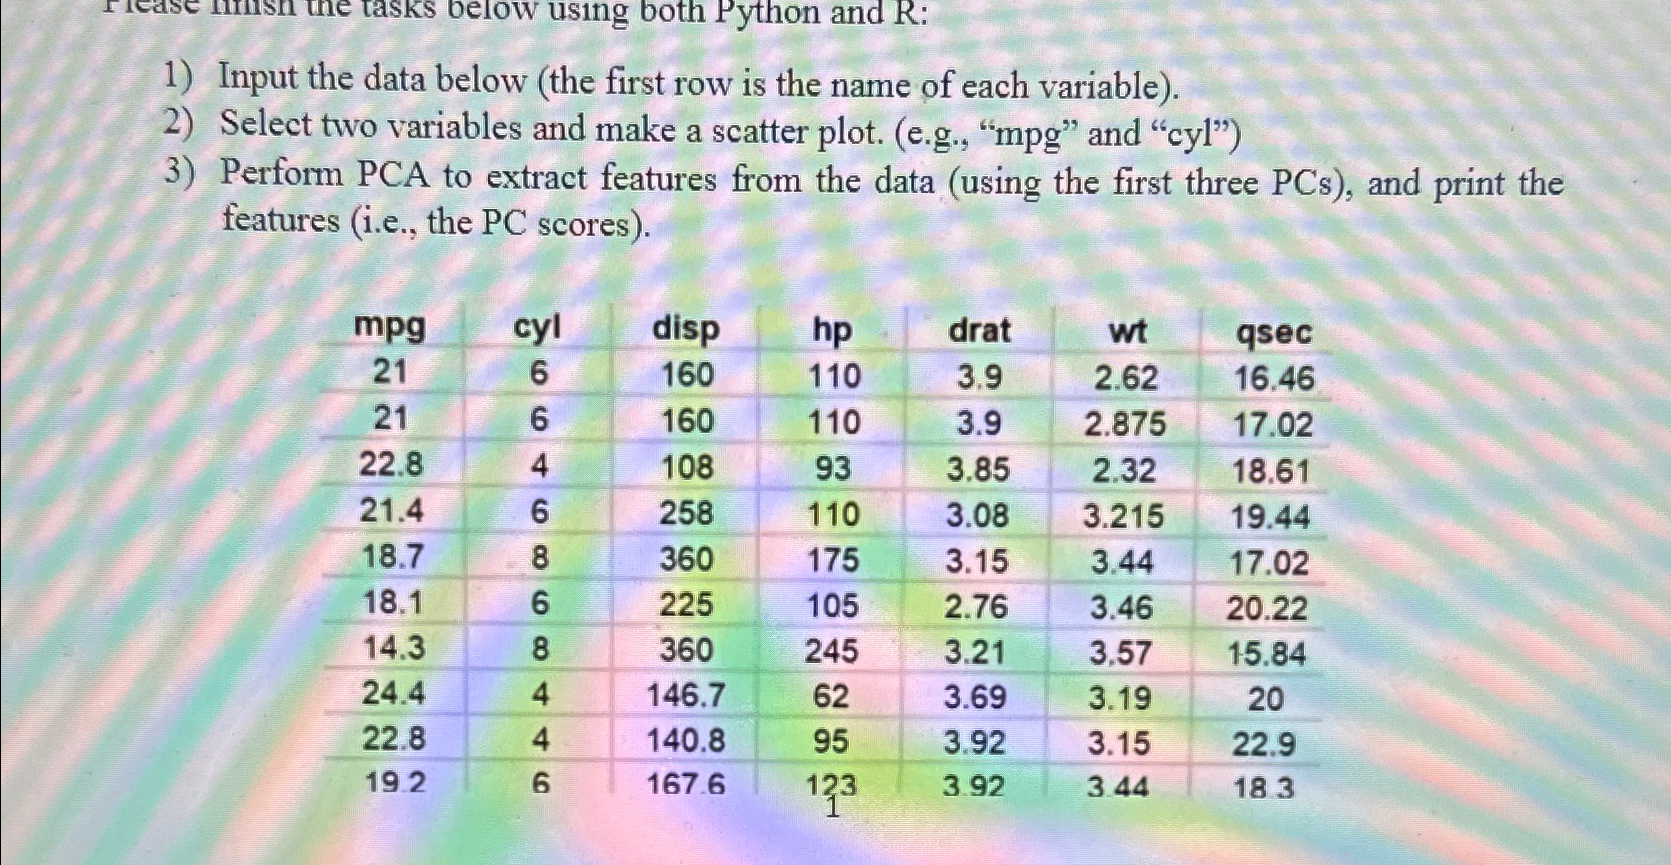
Question: Input the data below ( the first row is the name of each variable ) . Select two variables and make a scatter plot. (
Input the data below the first row is the name of each variable
Select two variables and make a scatter plot. egmpg and cyl
Perform PCA to extract features from the data using the first three PCs and print the features ie the PC scores
tablecyldisp,hpdrat,wtqsec
Step by Step Solution
There are 3 Steps involved in it
1 Expert Approved Answer
Step: 1 Unlock

Question Has Been Solved by an Expert!
Get step-by-step solutions from verified subject matter experts
Step: 2 Unlock
Step: 3 Unlock