

Question: Insert Draw Page Layout Formulas Data Review View RP ab Wrap Text Calibri 11 Copy $ . % .. Conditional Format as Formatting / U
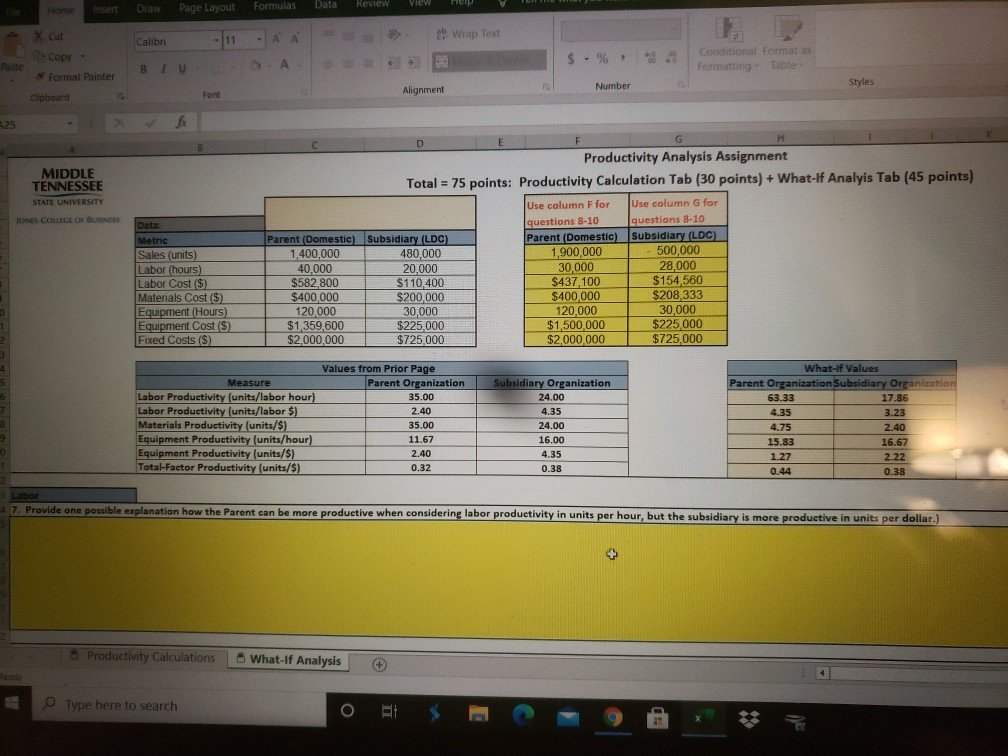
Insert Draw Page Layout Formulas Data Review View RP ab Wrap Text Calibri 11 Copy $ . % .. Conditional Format as Formatting / U Format Painter Number Styles Clipboard Alignment Font fr MIDDLE TENNESSEE STATE UNIVERSITY JONES COLLEGE OF BUSINESS Data: Metric Sales (units) Labor (hours) Labor Cost ($) Materials Cost($) Equipment (Hours) Equipment Cost (S) Fixed Costs ($) D E F G H Productivity Analysis Assignment Total = 75 points: Productivity Calculation Tab (30 points) + What If Analyis Tab (45 points) Use column F for Use column G for questions 8-10 questions 8-10 Parent (Domestic Subsidiary (LDC) Parent (Domestic) Subsidiary (LDC) 1,400,000 480.000 1,900,000 500,000 40.000 20,000 30,000 28,000 $582,800 $110,400 $154,560 $400 000 $200,000 $400,000 $208,333 120,000 30,000 120,000 30,000 $1,359,600 $225,000 $1,500,000 $225 000 $2,000,000 $2,000,000 $725.000 $437, 100 $725.000 Values from Prior Page Measure Parent Organization Labor Productivity (units/labor hour) 35.00 Labor Productivity (units/labor $) 2.40 Materials Productivity (units/s) 35.00 Equipment Productivity (units/hour) 11.67 Equipment Productivity (units/$) 2.40 Total-Factor Productivity (units/$) 0.32 Subsidiary Organization 24.00 4.35 24.00 16.00 4.35 0.38 What If Values Parent Organization Subsidiary Organization 63.33 17.86 4.35 3.23 4.75 2.40 15.83 16.67 1.27 2.22 0.44 0.38 3 Labor 7. Provide one possible explanation how the Parent can be more productive when considering labor productivity in units per hour, but the subsidiary is more productive in units per dollar.) Productivity Calculations What-If Analysis + Type here to search Insert Draw Page Layout Formulas Data Review View RP ab Wrap Text Calibri 11 Copy $ . % .. Conditional Format as Formatting / U Format Painter Number Styles Clipboard Alignment Font fr MIDDLE TENNESSEE STATE UNIVERSITY JONES COLLEGE OF BUSINESS Data: Metric Sales (units) Labor (hours) Labor Cost ($) Materials Cost($) Equipment (Hours) Equipment Cost (S) Fixed Costs ($) D E F G H Productivity Analysis Assignment Total = 75 points: Productivity Calculation Tab (30 points) + What If Analyis Tab (45 points) Use column F for Use column G for questions 8-10 questions 8-10 Parent (Domestic Subsidiary (LDC) Parent (Domestic) Subsidiary (LDC) 1,400,000 480.000 1,900,000 500,000 40.000 20,000 30,000 28,000 $582,800 $110,400 $154,560 $400 000 $200,000 $400,000 $208,333 120,000 30,000 120,000 30,000 $1,359,600 $225,000 $1,500,000 $225 000 $2,000,000 $2,000,000 $725.000 $437, 100 $725.000 Values from Prior Page Measure Parent Organization Labor Productivity (units/labor hour) 35.00 Labor Productivity (units/labor $) 2.40 Materials Productivity (units/s) 35.00 Equipment Productivity (units/hour) 11.67 Equipment Productivity (units/$) 2.40 Total-Factor Productivity (units/$) 0.32 Subsidiary Organization 24.00 4.35 24.00 16.00 4.35 0.38 What If Values Parent Organization Subsidiary Organization 63.33 17.86 4.35 3.23 4.75 2.40 15.83 16.67 1.27 2.22 0.44 0.38 3 Labor 7. Provide one possible explanation how the Parent can be more productive when considering labor productivity in units per hour, but the subsidiary is more productive in units per dollar.) Productivity Calculations What-If Analysis + Type here to search
Step by Step Solution
There are 3 Steps involved in it
1 Expert Approved Answer
Step: 1 Unlock

Question Has Been Solved by an Expert!
Get step-by-step solutions from verified subject matter experts
Step: 2 Unlock
Step: 3 Unlock