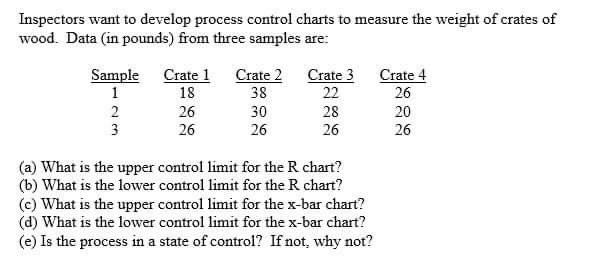
Question: Inspectors want to develop process control charts to measure the weight of crates of wood. Data (in pounds) from three samples are: Crate 2 Crate

Inspectors want to develop process control charts

Inspectors want to develop process control charts to measure the weight of crates of wood. Data (in pounds) from three samples are: Crate 2 Crate 4 18 38 Sample Crate 1 1 2 3 26 Crate 3 22 28 26 26 26 30 20 26 26 (a) What is the upper control limit for the R chart? (b) What is the lower control limit for the R chart? (c) What is the upper control limit for the x-bar chart? (d) What is the lower control limit for the x-bar chart? (e) Is the process in a state of control? If not, why not

Step by Step Solution

There are 3 Steps involved in it

1 Expert Approved Answer
Step: 1 Unlock blur-text-image
Question Has Been Solved by an Expert!

Get step-by-step solutions from verified subject matter experts

Step: 2 Unlock
Step: 3 Unlock

Students Have Also Explored These Related General Management Questions!