

Question: Instead of copying values from another person's solution, look up the constants yourself online. The Bohr model simulates observed wavelengths, , in an emission spectral
Instead of copying values from another person's solution, look up the constants yourself online.
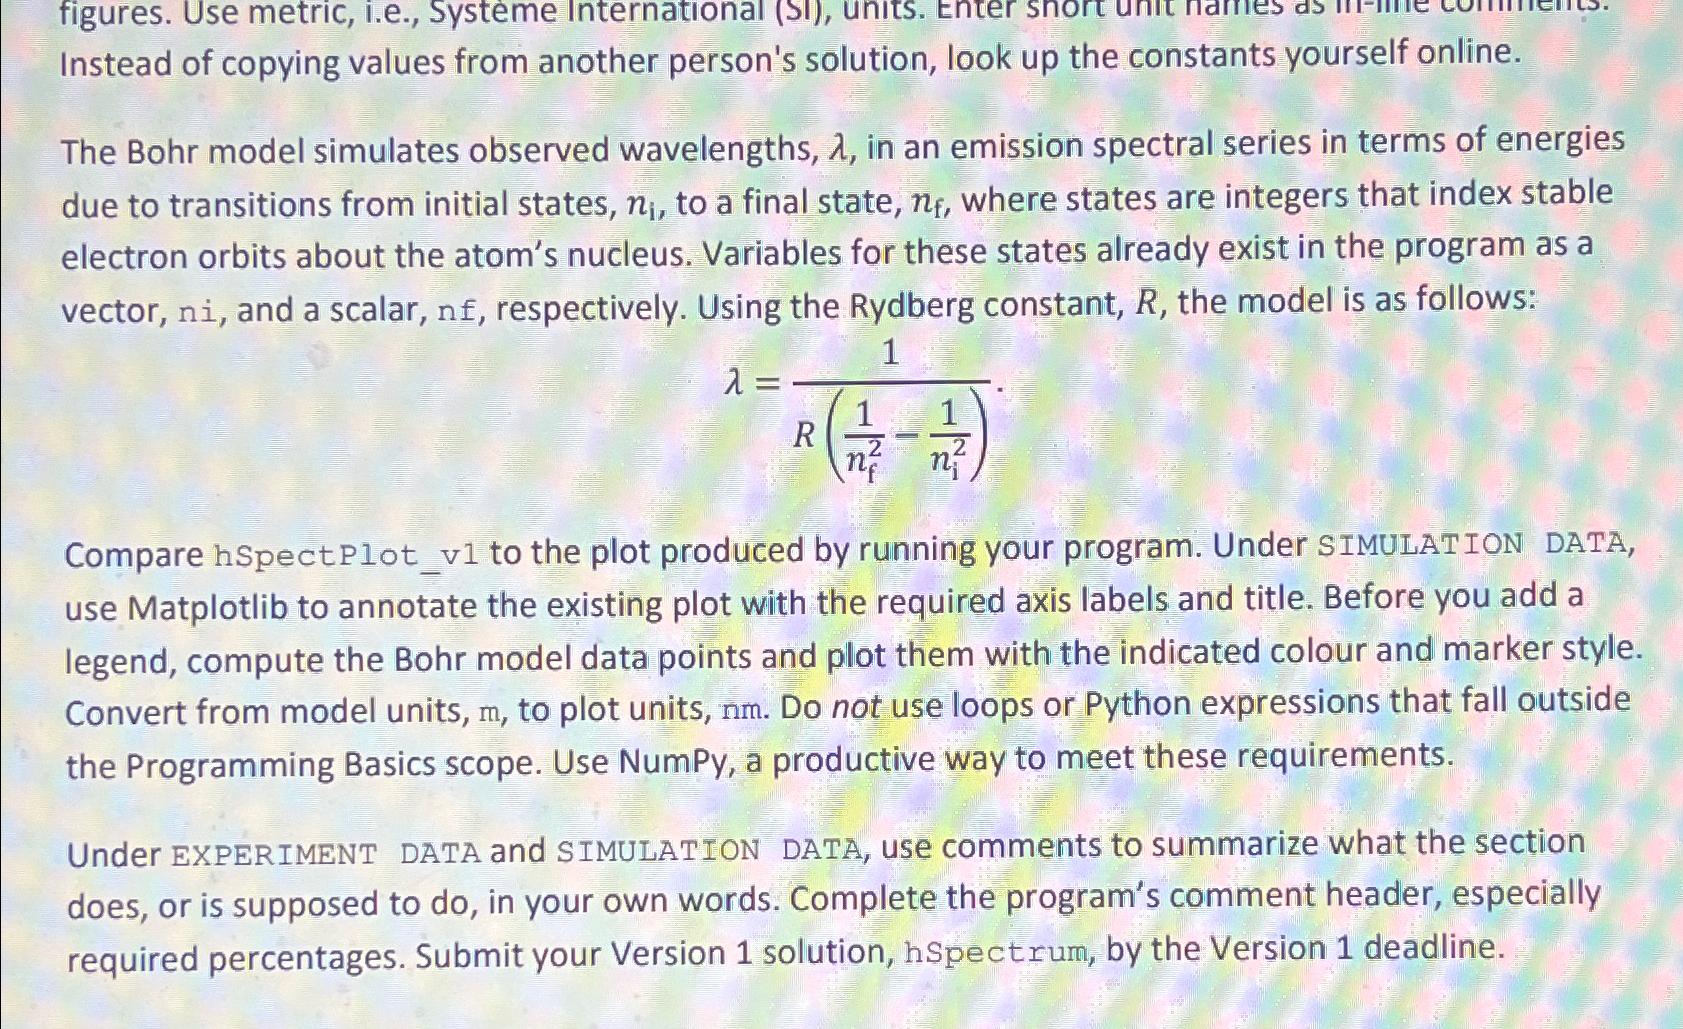
The Bohr model simulates observed wavelengths, in an emission spectral series in terms of energies due to transitions from initial states, to a final state, where states are integers that index stable electron orbits about the atom's nucleus. Variables for these states already exist in the program as a vector, and a scalar, respectively. Using the Rydberg constant, the model is as follows:
Compare hSpectPlotv to the plot produced by running your program. Under SIMULATION DATA, use Matplotlib to annotate the existing plot with the required axis labels and title. Before you add a legend, compute the Bohr model data points and plot them with the indicated colour and marker style. Convert from model units, to plot units, nm Do not use loops or Python expressions that fall outside the Programming Basics scope. Use NumPy, a productive way to meet these requirements.
Under EXPERIMENT DATA and SIMULATION DATA, use comments to summarize what the section does, or is supposed to do in your own words. Complete the program's comment header, especially required percentages. Submit your Version solution, hspect rum, by the Version deadline.
Step by Step Solution
There are 3 Steps involved in it
1 Expert Approved Answer
Step: 1 Unlock

Question Has Been Solved by an Expert!
Get step-by-step solutions from verified subject matter experts
Step: 2 Unlock
Step: 3 Unlock