

Question: Instruction: Plot the X and Y coordinates on excel scatter plot graph. You must show the scale settings of minimum and maximum bounds in Axis
Instruction: Plot the X and Y coordinates on excel scatter plot graph. You must show the scale settings of minimum and maximum bounds in "Axis options" and other necessary settings for showing the graph correctly.
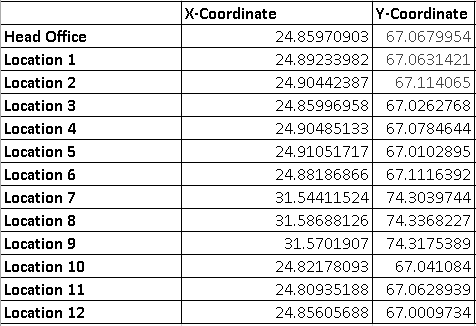
Head Office Location 1 Location 2 Location 3 Location 4 Location 5 Location 6 Location 7 Location 8 Location 9 Location 10 Location 11 Location 12 X-Coordinate Y-Coordinate 24.85970903 67.0679954 24.89233982 67.0631421 24.90442387 67.114065 24.85996958 67.0262768 24.90485133 67.0784644 24.91051717 67.0102895 24.88186866 67.1116392 31.54411524 74.3039744 31.58688126 74.3368227 31.5701907 74.3175389 24.82178093 67.041084 24.80935188 67.0628939 24.85605688 67.0009734Step by Step Solution
There are 3 Steps involved in it
1 Expert Approved Answer
Step: 1 Unlock

Question Has Been Solved by an Expert!
Get step-by-step solutions from verified subject matter experts
Step: 2 Unlock
Step: 3 Unlock