

Question: INSTRUCTION Show the complete work for all questions. QUESTION 1 A study found that average Malaysians are making average monthly debt payments of RM1200.
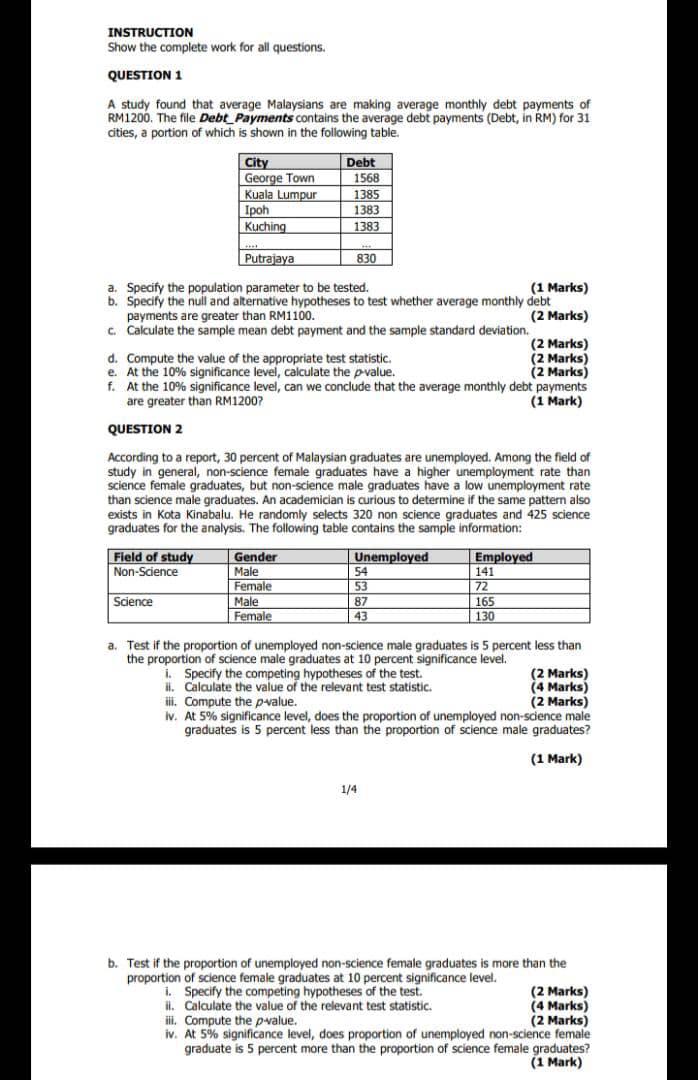
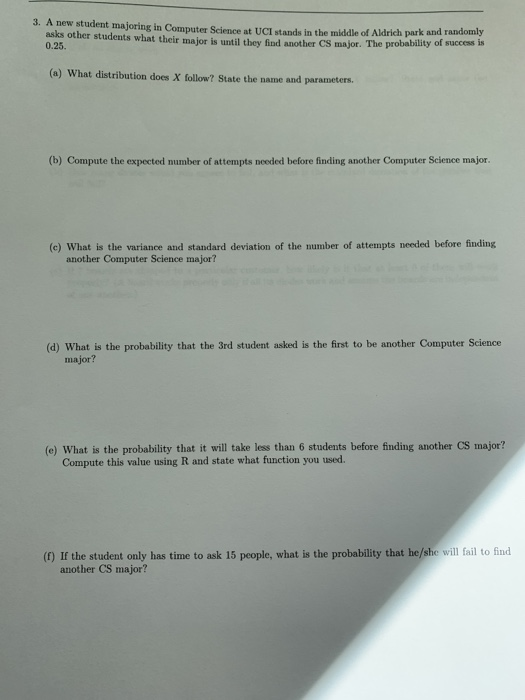
INSTRUCTION Show the complete work for all questions. QUESTION 1 A study found that average Malaysians are making average monthly debt payments of RM1200. The file Debt Payments contains the average debt payments (Debt, in RM) for 31 cities, a portion of which is shown in the following table. City George Town Debt 1568 Kuala Lumpur 1385 Ipoh 1383 Kuching 1383 Putrajaya 830 a. Specify the population parameter to be tested. (1 Marks) b. Specify the null and alternative hypotheses to test whether average monthly debt payments are greater than RM1100. (2 Marks) c. Calculate the sample mean debt payment and the sample standard deviation. (2 Marks) d. Compute the value of the appropriate test statistic. e. At the 10% significance level, calculate the p-value. (2 Marks) (2 Marks) (1 Mark) f. At the 10% significance level, can we conclude that the average monthly debt payments are greater than RM1200? QUESTION 2 According to a report, 30 percent of Malaysian graduates are unemployed. Among the field of study in general, non-science female graduates have a higher unemployment rate than science female graduates, but non-science male graduates have a low unemployment rate than science male graduates. An academician is curious to determine if the same pattern also exists in Kota Kinabalu. He randomly selects 320 non science graduates and 425 science graduates for the analysis. The following table contains the sample information: Field of study Gender Unemployed Non-Science Male 54 Female 53 Science Male 87 Female 43 Employed 141 72 165 130 a. Test if the proportion of unemployed non-science male graduates is 5 percent less than the proportion of science male graduates at 10 percent significance level. i. Specify the competing hypotheses of the test. ii. Calculate the value of the relevant test statistic. iii. Compute the p-value.. (2 Marks) (4 Marks) (2 Marks) iv. At 5% significance level, does the proportion of unemployed non-science male graduates is 5 percent less than the proportion of science male graduates? 1/4 (1 Mark) b. Test if the proportion of unemployed non-science female graduates is more than the proportion of science female graduates at 10 percent significance level. i. Specify the competing hypotheses of the test. ii. Calculate the value of the relevant test statistic. iii. Compute the p-value. (2 Marks) (4 Marks) (2 Marks) iv. At 5% significance level, does proportion of unemployed non-science female graduate is 5 percent more than the proportion of science female graduates? (1 Mark) 3. A new student majoring in Computer Science at UCI stands in the middle of Aldrich park and randomly asks other students what their major is until they find another CS major. The probability of success is 0.25. (a) What distribution does X follow? State the name and parameters. (b) Compute the expected number of attempts needed before finding another Computer Science major. (c) What is the variance and standard deviation of the number of attempts needed before finding another Computer Science major? (d) What is the probability that the 3rd student asked is the first to be another Computer Science major? (e) What is the probability that it will take less than 6 students before finding another CS major? Compute this value using R and state what function you used. (f) If the student only has time to ask 15 people, what is the probability that he/she will fail to find another CS major?
Step by Step Solution
There are 3 Steps involved in it

Get step-by-step solutions from verified subject matter experts