

Question: Instruction: show your working plan in flowchart or state diagram or pseudo code. Task 1 a: 1. Figure 1 shows a typical telco nodes that
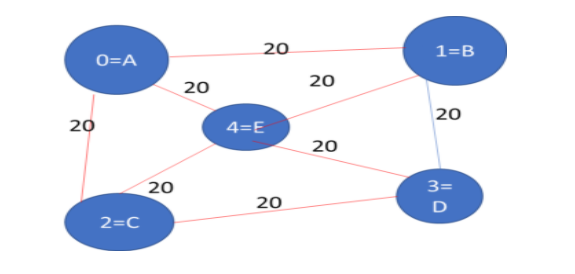
Instruction: show your working plan in flowchart or state diagram or pseudo code. Task 1 a: 1. Figure 1 shows a typical telco nodes that are connected by transmission links with the capacity shown. 2. Define Data Structures for a) Nodes, b) Links and capacity between two adjacent nodes as shown by the arrows c) Route between any origin and destination d) Route Sequence consisting of links between any origin and destination nodes. 3. Create occurrences of Nodes, Links, Route and Route Sequence by using the respective data structures. 4. Determine Node to Node Route plans from any originating Node to any destination Node without capacity demand. Print the results generated by the planning process. 5. Determine Node to Node Route plans from any originating Node to any destination Node with capacity demand 10 circuit out of the capcity. Print the results generated by the planning process. (use USE/AVAIL/CAPACITY) 6. Compare the results in step 4 and step 5 by giving your findings. Give comment on your results. 20 O=A 1=B 20 20 20 20 4=E 20 20 2=C 20 3= D
Step by Step Solution
There are 3 Steps involved in it

Get step-by-step solutions from verified subject matter experts